Monday, September 15, 2014

Blog Moved

Blog has moved to a new location. Please update your bookmark:
http://www.investorsanthology.com/

Friday, January 11, 2013

Second Level Thinking


For those few of you who still come back to this blog, I am alive. No activity for over a year probably had you thinking otherwise. Not much has happened investment wise over the last year, I didn't find any securities that matched my selection criteria. Hence the inactivity.

Today, I am writing about second-level thinking. This is a topic that many of you who are experienced value investors are already familiar. This is a post that is probably more useful to the non-investing or the non-value investor crowd. 

Howard Marks, a renowned distressed debt investor, wrote about second-level thinking in his book "The Most Important Thing: Uncommon Sense for the Thoughtful Investor". The book is an edited version of his memos (all his memos are here) that he has been writing to his shareholders for nearly two decades. I highly recommend reading the book. My favorite chapter is the first one: "Second Level Thinking".

Marks contention is that a lot of people do first level thinking, but very few seem to understand second level thinking. He considers the ability to exercise second level thinking of utmost importance to achieve market beating returns over a longer term. What is second level thinking? Let me give you some examples.

First level thinking says: "I love this company's products, it has a great culture. Let's buy the stock." Second level thinking says: "The company is doing well, but the expectations that its going to do well is already backed into the price and some more. The company is overrated. Let's sell."

First level thinking says: "I think the company's earnings will fall, let's sell." Second level thinking says: "I think the earnings will fall less than people expect, so the stock will go up because of the surprise. Let's buy."

Both of the above are rather simple examples, thinking at the second level is not too difficult. So, now that you understand the concept, let me use a real world discussion I have been having with a colleague (Mr. Page) in my professional life as an engineer. I consider this colleague to be among the very few smart and thoughtful people I know of. 
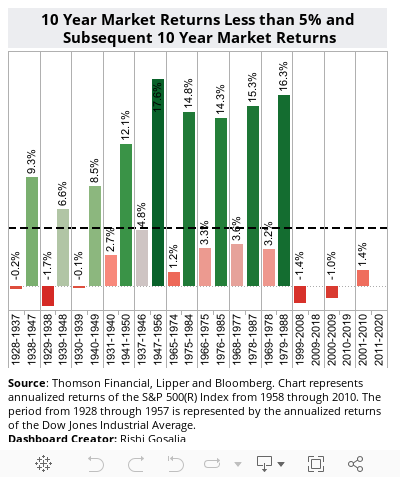
Page: "You know S&P 500 returns over the most recent decade have been really poor"

Gosalia: "Yeah, but historically, all "lost decades" have been followed by attractive returns for the following decade. Look at the data."


Gosalia: "This time may be different, but I would not use the most recent decade's poor performance as the reason for staying away from equities."

Page: "There are a lot of hidden details behind the numbers you don't see in the graph that are important to observe. You could look at WWI, New Deal, WWII, Federal Reserve Act, War on Poverty, Federal Reserve actions (specifically in 1937), Gold Reserve Act, 1971 complete disconnect of the US dollar from Gold, women entering the workforce, invention of 401(k), real estate easing, general population getting access to the markets, dot-com bubble, and the real-estate bubble."

These are really good observations by Page. But then he makes a first-level thinking observation, in my opinion: "The government's fiscal situation is terrible. It's ability to continue to prop up the economy will be limited going forward. You also have the baby boomers retiring. Baby boomers are the largest demographic in the country. These retirees, as they pull their money out, will continue to drag market returns for the next twenty or so years. I don't expect the economy to go anywhere for the next few decades."

I assuming that his conclusion to the above first-level observation is to avoid equities going forward, but if I am incorrectly interpreting his conclusion. my apologies Mr. Page. Here is my response which I believe is second-level thinking: 

"Yes, baby boomers will be retiring and looking to "pull" out their money. But geez, where will they stuff this money into. Taking all this capital out and putting it into their "mattresses" is not an option. When capital disappears from one part of the system it shows up somewhere else. One thing retirees really need is regular income. Will they pour their massive capital base into fixed income. That will surely kill any aspirations they have for any regular income. More money into bonds will bid up bond prices and lower their yields. Combine it with the fact that yields are already near zero, putting retiree capital into fixed income is as good as stuffing into their mattress.

I think its more likely that retiree 401(k) capital will move into high dividend yielding stocks to support their need for regular income. Hmm, where I am to look for high dividend stocks. REITS pay out large dividends, don't they? But that's first level thinking. Everyone knows they pay out all their earnings in dividends, so the stock prices are  currently bid up causing effective yield rates to be lower. Second level thinking tells me that I should be looking for companies that have very low dividends currently but have a very long runway for dividend growth. Wall Street is not expecting them to raise dividends anytime soon, so their stock price don't account for it. 

Hmm, so what kind of stocks can raise their dividends but haven't done so yet. How about the banks? Banks don't need much capital to grow, as long as they are well capitalized, the rest of the capital can be returned to shareholders. The Fed has explicitly capped dividends for many of the large banks that have been recipients of bailouts. First level thinking: so you want me to invest in these "evil-doer" bailed out banks run by irresponsible managers? Second-level thinking: There are some 7000 banks in the US, and only a few were responsible for the "evil-doing". In addition, the Fed "bailed" out many banks that weren't under duress during the financial crisis to disguise from the general public the banks that were really under duress.

May be, I can find a bank run by responsible and trustworthy managers that has a healthy balance sheet and can grow its dividends. How about Wells Fargo? They didn't use customer deposits to gamble on derivatives trading. They weren't involved in sub-prime lending. Their balance sheet prior to the Wachovia acquisition was relatively clean and easy to understand. Post Wachovia, its already been a few years and those loans are aging well. They have a lot of capital in reserve to absorb any future expected losses, more so than going into the financial crisis. 

With strengthened balance sheets, I find it hard to envision such hard dividend caps on the healthy banks, say 8-10 years from now worst case. Wells Fargo currently only pays 10-20% of its earnings out as dividend. Management has clearly indicated that they would like to grow dividend payout ratio to 50%. Combine it with the fact that housing will eventually come back, causing earnings to grow as well. If yields rise because of retirees pouring money into fixed income products, that helps Wells Fargo since it is an "asset-sensitive" bank - meaning the rate at which it lends goes up higher the rates it has to pay on its deposits. The deposits they have are very sticky and are unlikely to leave for a higher yield. The spread leads to higher returns on capital. 

Second-level thinking question: Are any of these observations about Wells Fargo baked into its stock price (at $23 when I purchased the stock in 2011)? Its trading at book value and less than 10x P/E. Definitely not, Wall Street is simply ignoring these observations. They don't have a longer time frame like I do. But may be someone else is making similar observations. Let's check out 13-Ds. Hmm, Warren Buffett has been buying loads of Wells Fargo stock. Is he thinking along the same lines?

What kind of returns could I expect buying Wells Fargo at $23 a stock at book value and 9-10x P/E. Well, Wells Fargo has been doing about 1.2% to 1.3% return on assets. It is levered equity to assets by 10x. So, it is currently doing about 12% to 13% ROE. USBank, a close peer to Wells Fargo, has been able to do 1.5% ROA. If Wells can get there in a a year or two, Wells will be compounding book value at 15%. So, book value will be double in about 5-6 years. Current book value is 20-23 (as 2011 when I purchased the stock), so it could easily be at 40-45$ in 5-6 years. But a bank achieving that kind of ROE shouldn't be trading at book but at least 1.5x book value. So, the stock is worth about $65 - $70 given a 5-7 year horizon. Buying at $23, lets just round to $25, you are able to make a 2.5x return on your capital in 5-7 years or 17% compounded return. Another way to look at it is Wells is earning about 3-4$ in EPS. It could be double its EPS in 7 years, so EPS could be at 6-8$. If it pays out 50% in dividends, its paying 3-4$ dividend. Should the dividend yield of the stock be 5%, you get a price of 60-80$. Is any of this pie in the sky - not at all. We have such a huge margin for error buying at $23 that even if things didn't work out as laid out above, the buffer could easily absorb enough wrong things that could happen before I lost money. Much better than stuffing my money in the "mattress" of fixed income or any other alternative asset class (gold, silver, art, wine .. ).

So, may be all of this second-level thinking makes sense on an individual stock level. But how does that apply to general market returns. What will S&P500 do over the next few decades. My response: I don't care, my job is not to predict returns for overall market, but to make investments that produce 12% + inflation beating returns over the longer term. Questions like what will S&P do and what will the economy do has nothing to do with investment success at the individual level. Conclusions like "lets avoid equity" because of such and such reason don't really apply."

Howard Marks says that first level thinking is simplistic and superficial, just about everyone can do it. All first level thinking needs is an opinion about the future, as in "the outlook stinks, call for low growth and rising inflation. let's dump our stocks".

Second level thinking is deep, complex and convoluted. The second-level thinker takes a great many things into account:
  • What is the range of likely future outcomes?
  • Which outcome do I think will occur?
  • What does the consensus think?
  • How does my expectation differ from the consensus?
  • How does the current price for the asset comport with the consensus view of the future, and with mine?
  • Is the consensus psychology that's incorporated in the price too bullish or bearish?
  • What will happen to the asset's price is the consensus turns out to be right, and what if I'm right?
  • ...
The difference in workload between first-level and second-level thinking is clearly massive. First level thinkers look for simple formulas and easy answers to investing problems. The problem is that extraordinary performance comes only from correct non consensus forecasts, but non consensus forecasts are hard to make, hard to make correctly and hard to act on.

I don't claim that I am a second-level thinker and someone else isn't. I know Mr. Page is a very smart man, and he may also be thinking at a second level and I am not aware of those thoughts. 

Having said that, the first step is recognize what is needed for investment success. The second step is to start exercising this kind of thinking into our investment process. Currently this is a conscious effort for me to exercise this kind of thinking and not fall prey to first level thinking. 

Sunday, December 18, 2011

Fundamentals of Value Creation - Part II

This is part II of my previous post on the Fundamentals of Value Creation. In part I, we described how value creation can be quantitatively captured by looking at two key variables: growth rate (g) of NOPAT and return on invested capital (ROIC). If you are not familiar with these concepts, I recommend you read part I (here) before continuing. 

A computer could easily give you a list of all companies that have grown at healthy rates and at ROIC that consistently exceeded the cost of capital by some reasonably wide margin. In fact, Joel's Greenblatt's "Magic Formula" screen (based on his book Little Book that Beats the Market) is programmed to almost do this - find high ROIC companies trading at cheap valuations. The formula has shown to work well if you stay disciplined and stick to the formula even when it looks like it isn't working. 

I believe a "defensive" investor (investors that are unable to devote much time to the process of investing) will be well served by just sticking to the prescriptions laid out by Mr. Greenblatt in his book. However, for the "enterprising" investor (investors that are willing to put the time and thought required for the process of making sound investing decisions) the edge is in going one step further and digging answers to questions like:
  1. Why does an industry on average generate a high (or low) ROIC? (I'll just focus on ROIC instead of g since analyzing the drivers of g are well popularized).
  2. Why is this company's ROIC so much higher (or lower) than the industry?
  3. Can it continue to perform at these levels? What will be the impact of management's current actions on  company's future ROIC? 
Fortunately, I am not the first one to ask these questions. Renowned Harvard Business School professor, Michael Porter, addressed these questions in his two books that are now classics, Competitive Strategy (1980) and Competitive Advantage (1985) and numerous other HBR articles published since then.

Returns in a business are highly dependent on the industry in which it operates. Pharmaceutical and biotechnology companies protected by patents have produced a median returns of 23.5%, whereas most airlines have destroyed capital.


The reason for difference in industries performance lies mainly in differences between their competitive structures. When most people think of competition, they think of the rivals trying to earn the sale. However, competition for returns is actually a struggle between multiple players, not just rivals, over who will capture the value an industry creates. It's true, of course, that companies compete for profits with their rivals. But they are also engaged in a struggle for profits with their customers, who would be happy to pay less and get more. They compete with their suppliers, who would always be happier to be paid more and deliver less. They compete with producers who make products that could be substituted for their own. And they compete with potential rivals as well as existing ones, because even the threat of new entrants place limits on how much they can charge their customers. These five forces - the intensity of rivalry among existing competitors, the bargaining power of buyers, the bargaining power of suppliers, the threat of substitutes, and the threat of new entrants - determine the industry's competitive structure which in turn determine to a large degree the returns that a business in that industry generates.

The best way to learn about the five forces framework is to apply it to a specific industry. We'll use the example of the airline industry to gain a much deeper insight into the underlying reasons for the industry's poor record for value creation.

Intensity of Rivalry:
Rivalry in the airline industry is highly intense. Intensive rivalry is a driven by a number of underlying characteristics of airline transport. At its core, the aggressive buildup of capacity that never leaves the industry drives pricing decisions that fail to support attractive returns.
  1. Perishable Product: An unfilled airline seat cannot be stored. Costs for providing capacity are thus largely sunk in the short term thus creating severe pressure on price discounting. 
  2. Undifferentiated Product: The product offered is highly similar across airlines as new product features (flat bed, entertainment system etc.) are quickly imitated among peers. 
  3. Low Marginal Cost Structure: High fixed costs exist at the level of individual aircraft, marginal costs for adding additional customers are very low, which further reinforces price discounting.
  4. High Exit Barriers: The disappearance of capacity and exit of companies are two key adjustment mechanisms through which other industries support normal returns. In the airline industry, neither of the two adjustment mechanisms work: 
    • Aircraft capacity can easily be deployed to different geographic markets. Thus, even if particular companies might leave the market, airline capacity usually stays in the market, and disappears only in the long run. 
    • Less than 1% of airlines exit the market in an average year. 
      • Governments have a tradition of bailing out airlines. In the US, Chapter 11 forces the debtors to provide the bailout; both mechanisms allow companies to shed some of their fixed costs. Management is often not held accountable in a bailout, reducing the disincentives for managers to avoid going through such periods. 
      • There are also specific other barriers that limit airlines ability to reduce capacity overall and on specific routes. 
        • Airlines are forced to take a capital loss charge if they sell an aircraft in a downturn. Getting out of a leasing contract is equally costly in a downturn. Keeping capacity idle is costly, but it avoids the capital loss. 
        • Gradual reduction in capacity is also complicated by need to retire by aircraft, not by seat. 
        • Use-it-or-lose-it rules on airport slots create barriers to exit from routes. Losing a connection can have ripple effects on other parts of the network for carriers that use the hub-and-spoke-model. 
        • And lastly, reducing capacity by moving to a smaller aircraft on specific connections increases the average cost per available seat kilometer. 
Bargaining Power of Customers:
Customer bargaining power is high and rising driven by the following factors:
  1. Power of Channels:
    • Aggregator website have concentrated consumers' buying power. Their focus on price comparison has significantly increased the transparency of prices across carriers. Global distributions systems (GDSs) have made it very easy for new aggregator websites to enter the market. The strong market power of the three dominant GDSs has triggered the current conflict between GDSs and US airlines.
    • Travel agents now often represent the entire demand of large corporate clients, with significant power to move demand across carriers. Furthermore, agents have to comply with corporate policies that have become more price oriented.
  2. Power of End Consumers:
    • Air travel for leisure customers is a significant discretionary spending item, increasing price sensitivity.
    • Switching costs are very low for leisure customers. Loyalty programs primarily matter to those who are traveling extensively on business.
    • Frequency of a particular route is the key (and probably the only) differentiator among airlines of a similar type for a given connection for business travelers.
Bargaining Power of Suppliers
The bargaining power of suppliers is high for several critical inputs.
  1. Airframe and engine manufacturers:
    • Airframe and engine manufacturers are highly concentrated globally. These suppliers have high bargaining power.
    • Switching costs between airframes and engines are modest. There are some fixed costs of introducing a new type of aircraft/engine to a fleet. For new aircraft, the often significant type lag between order and production create some switching barriers.
    • Airframe and engine manufacturers have important alternate markets that they can sell to, especially the market for defense equipment.
    • Airframe manufacturers have thus far not exploited their bargaining power to maximize their short-term returns. They have, however, been able to shift most of the market risk associated with aircraft purchases to airlines.
    • The aggressive competition between aircraft manufacturers has hurt the airline industry structure by encouraging aggressive capacity buildup and reducing barriers to entry into the airline industry.
  2. Labor
    • Airlines are dependent on skilled employees, pilots and technical personnel. Network airlines (ones that operate hub-and-spoke model) are particularly vulnerable to disruptions at their hubs, which increases power of unions at these locations
    • Unions tend to be local monopolies. In airlines there are different unions for different types of staff, with each of them having the ability to disrupt operations. Union power and regulation have led to significant lack of downward flexibility in staffing levels and wages, especially for legacy airlines.
    • There are significant cost differences between new entrants, companies in bankruptcy protection, and unionized incumbents, where high wages continue to be paid relative to other industries, especially for employees with specialized skills like pilots.
    • Employees have traditionally one of the groups most successful in capturing the value created by the airline industry. They remain powerful where labor regulations and hub-and-spoke give them leverage. Because union power increases as companies mature, the nature of labor relations also erodes industry structure by encouraging entrants and bankruptcy to avoid union related costs, even if there is no productive advantage.
  3. Airports
    • Many airports are local monopolies with limited competition from nearby secondary airports. There is little entry by new airports, so the main check of the exploitation of market power is through regulation. The pricing power that the local monopoly gives to an airport depends significantly on the potential traffic flows to which it provides access.
    • Many airports in the US continue to be used by local governments to foster economic development through subsidizing airlines' operations. On average airports do not earn their cost of capital.
    • Airport switching costs are high, especially for network airlines that are focused on providing connections. It is easier for point-to-point airlines, especially low cost carriers (LCC) flying to larger metropolitan areas with a number of airports or regional airports not served by network airlines. 
    • Airports marginally better profitability compared to airlines indicates that their effective bargaining power has been limited. The main impact on airline industry structure has been through infrastructure capacity constraints and other operational practices that have limited effective capacity adjustments in serving particular connections
  4. Ground handling services / catering
    • They have limited bargaining power, largely because airlines have the option of providing the service in-house. 
Threat of Substitutes
The most powerful substitute to aircraft travel is the decision not to travel. 
  1. Time and inconvenience of security measures have reduced the overall attractiveness of scheduled airlines transport relative to substitutes.
  2. For short-haul connections, a key concern of airline passengers is punctuality. While airlines have some control, the key drivers for delays are the air control systems and airports.
  3. The slightly growing role of substitutes such as video conferencing for business travel has been driven by improvements in their performance and falling costs.
Threat of New Entrants
The threat of new entrants is high. Over 1,300 new airlines were established in the past 40 years, an average of over 30 each year. Entry has been highly cyclical. Remarkably, entry rates have shown no sign of slowing down despite low industry profitability.
  1. Economies of scale exist on the demand side, i.e. it is easier to generate demand with a strong brand, a wide distribution presence, and a large network of connections. There are also benefits from established operations in generating route density to allow larger aircraft (lower costs) and higher frequency (higher price). But since most of the entry is through existing airlines operating in adjacent geographies that do not face these barriers, these factors do not significantly deter entry.
  2. Supply-side economies of scale are limited as airlines grow beyond a level of around 50 aircraft. This creates some disadvantages for new airlines but not for existing ones looking to expand into new markets. Because capacity comes in lumps, airlines operating in adjacent geographies face the lowest entry barriers. They can serve a new destination through spare capacity on existing airplanes
  3. Access to distribution channels is easy for new entrants, much more so than in the past. GDSs and the internet now enable new airlines to list and make their flights available through a larger number of aggregator websites and travel agencies. This is a big change from the past where reservation systems and travel agents were controlled by incumbents.
  4. Legacy rights on slots give some advantages but there is secondary trading of slots at congested airports and thus no advantages until slot capacity is reached. If infrastructure does not grow in line with travel volumes, however, it can become an increasing bottleneck limiting entry at most frequented hubs.
  5. Substantial capital is needed to acquire a new aircraft. Prior to the financial crisis, however, external financing was widely available. The growing presence of leasing companies reduces capital requirements. However, it remains hard for new entrants to meet operational cash flow requirements during persistent downturns.

As you can see, the airline industry is squeezed by all the five forces causing it to have the worst economics for any industry. In fact, airlines capture the least value among all the players in the entire supply chain.


This concludes our discussion on the first question we raised at the beginning of this article: "Why does an industry have a high or low ROIC?". It's primarily a result of the five competitive forces that shape the industry structure. 

Just because the industry on the whole has been destroying value doesn't mean that there aren't individual operators that aren't achieving returns above the cost of capital. As a matter of fact, there are quite a few that have generated large economic value. This will be the purpose of the article in the next part in this series. We'll use the example of Southwest airlines to answer the remaining two questions raised at the beginning: "Why does a company have ROIC much higher than the rest of the industry?" and "What will be result of management's current actions on future ROIC?"


Southwest airlines, a low cost carrier, had a strong value creator record in 1980s and 1990s. However, during the 2000s, once the impact of the well timed fuel hedging is removed, Southwest seems to have destroyed capital. Thus, it is instructive to closely examine Southwest because it will answer both the remaining questions. To be continued.. 


References:
  • What is Strategy, Michael Porter, Harvard Business Review
  • The Five Competitive Forces that Shape Strategy, Michael Porter, Harvard Business Review
  • Understanding Porter, Joan Magretta, Harvard Business Review Press
  • Vision 2050, International Air Transport Association, Feb 2011

Wednesday, December 7, 2011

Economics of Two-Sided Markets and MasterCard

I pitched MasterCard on this blog (here) in Dec 2010 when it was trading at $225. My thesis worked out as I had laid out then, Federal Reserve came out with its final ruling on Durbin in July 2011 and it was more lenient than their original proposal in Dec 2010. Mr. Market responded to these news quite favorably and the stock is up 65% from the price at which I initiated my position. Today, I view MasterCard as being a bit overvalued, so I have no plans to add to this position. But since I have been talking about two-sided markets (here and here), I thought it would be a good idea to talk about how this applies to MasterCard.

When a consumer swipes her debit (or credit) card issued by a bank to pay for a $100 merchandise at Walmart, an entity known as the merchant acquirer charges Walmart an interchange fee in the range of 20-25c for the debit transaction. The setting of the interchange fee is a complicated matter and it's set by MasterCard. The merchant acquirer retains a small percent of the interchange fee and passes off a large portion to the issuer bank. MasterCard charges the bank a very small transaction fee for using the network, but net MasterCard is essentially letting the bank make the most from the interchange fee, hence the banks are on the subsidy side. MasterCard also makes a very small transaction fee from the acquirer. So, even though the merchant is not compensating MasterCard, I still consider it to be the money side of the network since it's the one paying for the subsidy MasterCard is providing to the banks.

I believe that understanding the pricing model is really important for one to understand MasterCard (or Visa's) competitive advantages to any possible threats from new entrants. When I talked to people about MasterCard, most people would just say - "plastic is a dying business, mobile payments will displace them". So, I want to address this issue. 

Plastic or wireless, businesses don't exist just purely on technology in any two sided market (remember the Adobe example). The economics matter for them to come into existence. So, let's conjure up some wireless payment company (Verizon, AT&T, Google, Apple or someone else) that is going to compete with Visa/MasterCard/Visa.

Can they get the banks to co-operate with them without Visa and MasterCard in the picture?
Why would Chase give up its huge revenue stream from the interchange fee (thanks to Visa/MasterCard) and  partner up with some cute technology company? They have no incentive to do so, unless these new networks provide a compelling reason - meaning interchange fee that is healthy enough to force them to upset their big money center, MasterCard/Visa. Where exactly is this network going to come up with this money to compensate the banks from? Either they are willing to lose billions for years or charge the merchants a fee even higher than the MasterCard/Visa's interchange fee. So, then why would merchants be enthusiastic of accepting this new technology if it costs of them more than traditional technology? I doubt banks will co-operate with the new networks if MasterCard/Visa are not part of the network.

Can the new networks compete without Visa/MasterCard and the banks?
Where are they going to make the money from? Executives at Apple are not sitting around conjuring up new ideas to go into without have a proper model of where the revenues are going to come from, are they? So either they charge the consumer on a per transaction basis or they charge the merchants. Let's explore the first idea - charge the consumers. This pricing model is like Adobe charging each reader of the PDF document a 5c viewing fee. Are you willing to pay such a fee? You can always find suckers for anything, but I doubt that the network can grow big enough to make any economic sense with this model. Then, the only place they can make money from is by charging the merchants. It can probably get traction with the merchants only if Apple  charges transaction fees that are lower than the current interchange fee (why would Walmart want to install new point-of-sale systems that accept Apple payments otherwise). But Apple has way fewer transactions when it starts out. So, it has to amortize the fixed costs of running a payment network over a much smaller revenue stream. 

Let's compare this to the cost structure of MasterCard/Visa. As per data put out by the Fed in Dec 2010, MasterCard/Visa make less than 2c per transaction from the big banks (which control 80% of payments) on debit transactions and my guess is that they make less than 10c on credit transactions from the big banks. Combine with the fact that they capture trillions of transactions (over 70% of all transactions) and hence they are able to cover the costs of running a business and make healthy margins. 

Apple (or any other mobile network that wants to do it on its own) basically must be willing to lose money for a long time before they can capture volumes that make the business economically viable. One may say that isn't running a payment network no incremental cost to running a voice network and the argument that Apple needs a large volume to amortize costs is incorrect? Payment networks are very different relative to voice networks. You can have missed calls on voice network, but not on a payment network. When was the last time you were stuck at a grocery line because the payment network was down. Most of the times it's because of a hold on the card, but not because the network is down. Payment networks need to be more secure than voice networks. I have had my credit card stolen online quite a few times, but every time it happened I didn't detect the theft, but a representative from MasterCard would call me to tell me that certain suspicious transactions were detected. As per data by the Fed, the costs of running fraud detection are not something you can just ignore. Would you be willing to use a payment network that didn't have this protection? 

Lastly, there is nothing from a business point of view that is stopping MasterCard/Visa to partner up with another technology that competes with the ones that goes out on its own. MasterCard/Visa can take a margin cut for a few years and subsidize the technology partner for acting as a replacement for plastic. Who would not want to get this low risk revenue stream that starts on day one? In fact, that is what MasterCard exactly did by partnering with Telefonica for mobile payments in Latin America. The margin squeeze is not even permanent, because MasterCard/Visa can probably make it up by raising the interchange fees over time. 

I know the word "moat" gets thrown around a lot, so its really important to understand the underlying reason for the "moat" before one declares a business to have a moat. Without this kind of understanding, it's hard to monitor if the moat of the business is growing or decaying. If I can't do this type of analysis, I don't want to call the business to have a moat or rely on it. 

I say both MasterCard/Visa have a moat and I encourage you to challenge my reasoning I laid out here. Feel free to leave a comment or email me at rgosalia at gmail dot com.

Monday, December 5, 2011

Economics of Two-Sided Markets and the Future of Newspapers - Part II

This is a continuation of a previous post I did a few days ago here where we talked about general economics of any two sided market.

Let's apply it to the news business (ideas mostly from Dr. Alstyne's talk at UC Berkeley Media Tech Summit):

Ability to Capture Cross-Side Effects: The emergence of new digital platforms brought about the weakening of the newspapers' ability to capture cross side effects. Newspapers' subsidy side, the subscribers, started to flock to free digital platforms (Yahoo, CNBC, blogs) to keep up with daily news. Newspapers' money side, the advertisers, started to move to digital platforms that were either free (Craigslist) or more efficient (Google).

Marginal Costs & Value Add: The newspaper executives were just too slow to re-innovate their business models. When news facts such as who won the election or what's happening in Iran cannot be owned, they were bound to be disinter-mediated as new means of distribution became available thanks to the internet and search engines. Instead of trying to protect "content" (which they don't own anyway), newspapers executives should have realized that the marginal cost of distributing digital news is very low relative to print, and should have driven readership to their own digital websites (happening but a bit too late). A portion of the (subscriber) print revenues could be replaced by a fee-model through value added services on top of the free news content. One could argue that if newspapers could have retained (can retain) their subsidy side, the money side, the advertisers, would continue to be attracted to the newspaper network (albeit at lower rates).

So what kind of value added services a digital newspaper have that could attract readership away from blogs and other low quality sites.
  1. Interactive Data: Data such as state-to-state employment rate cannot be owned, but having an interactive application (such as here) is a good example of a value add.
  2. Credentialing: Anyone can aggregate data, but the ability to validate data using sophisticated algorithms is another example of value add. FiveThirtyEight is a polling website (now a licensed feature of New York Times) that rates errors of polls and produces pretty accurate statistical models. 
  3. User Generated Content: Amazon and Slashdot essentially created a business around the concept of using user generated content to add value. Today you see it as comments on a story on a digital news article, but one could go further by helping a user clear the cutter in smart ways (again look at Amazon or Slashdot).
  4. Ability to search archives: The search engines algorithm are smart when you are trying to find content that is hyper linked. So if you were trying to find content that is a few years old (this is a just an argument for long-tail), then the newspapers could add value by letting you search their print archives. Now imagine if I could connect this with my stock portfolio and quickly get a news time line for the last 10 years for all articles that have shown up on WSJ print that in my opinion would be super useful. 
Price Sensitivity: Dr. Alstyne gives the example of "technical" journals he receives today that are free (subsidy side) and the contributor is the one who is charged to reach the vast audience. I am not sure how this exactly applies to the newspaper business, but price sensitivity is one area that could be further explored.

Having said all of the above, I think the newspaper business is a tough one to be in going forward. When you have a business that goes from being a monopoly to one that faces multiple competitive threats, it is not an easy transition. 

I encourage you to listen to (or read) John Temple's talk about the lessons he learnt as an editor and publisher at Rocky Mountain News, one of the top newspapers in Denver Colorado. He tells you what kind of internal forces were at play within the company as these industry headwinds were playing out. I find this kind of postmortem analysis very interesting as an investor because "All I want to know is where I am going to die, and I'll never go there" (Charlie Munger).

Thursday, December 1, 2011

Economics of Two-Sided Markets and the Future of Newspapers

Warren Buffett recently announced the purchase of his hometown newspaper company, Omaha World-Herald. I have no opinion on the purchase, but I am going to use this occasion to talk about the economics of  business' that are like that of newspapers and apply these economic principles to the evolving newspaper business. Before I begin, I want to acknowledge that my thoughts on this topic absolutely not original, but come from a Boston University professor, Marshall Van Alstyne, one of the top researchers in this area.


The newspapers are an example of a "two-sided markets". Two-sided markets are economic platforms that bring together two different user groups that provide each other with network benefits. Other examples include credit cards (cardholders and merchants), HMOs (patients and doctors), operating systems (end-users and developers), video game consoles (gamers and game developers), web search engines (searchers and advertisers), and social networks (web "socializers" and advertisers).


First we'll begin by going back to your Econ 101 class. Usually for a market, the demand curve is downward sloping and you lower the price until value on the next unit sold makes up for the losses on sales you would have made at a higher prices. As you would expect, it makes no sense to give away your product for free because that gives up all profits on every unit sold. What makes two-sided markets special, despite what  your Econ 101 class tells you, is that sometimes it can make sense to give away your product for free (or subsidize them) because it could stimulate demand in an adjacent market you own that more than makes up for the subsidy.

Let me give you an example that you may not have thought of. Consider Abode's Portable Document Format (PDF) format, a standard used for universal document exchange. The PDF network consists of two sets of users - writers, who create documents using Adobe's Acrobat Distiller software that costs them $499, and readers, who view these documents using Abode's Acrobat Reader software that they can download for free. Writers, who greatly value the huge reader audience, are more than willing to pay a fee for their software. Adobe's subsidy of giving away the PDF reader for free is more than compensated by the higher demand in its writer software. Now here is an instance where giving away something for free makes sense!

Unlike the traditional markets, economics in the two-sided markets are more complicated. Dr. Alstyne prescribes a few factors to think about in order to make the network work correctly.

User Sensitivity to Price: Had Adobe started out charging even a small fee to the price sensitive reader group, the network would not have grown as big as it is today. Subsidize the group that is price sensitive ("subsidy side") and charge the side ("money side") that increases its demand more strongly in response to the other side's growth

User Sensitivity to Quality: Counter-intuitively, rather than charging the side that strongly demands quality, you charge the side that supplies quality. Think about the video game market. Gamers demand quality and game developers must incur huge fixed costs to deliver this quality. In order to amortize this cost, they must be ensured that the game console platform has many users. Hence the need to subsidize the gamers with a below cost subsidy.  Console providers ensure that game developers meet high quality standards by imposing strict licensing terms and high royalty rates. This "tax" is not passed to the consumers: the game developers charge the highest rates the gamers will bear, independent of the royalty rate. However, the royalty rate helps weed out games of marginal quality. Once the "tax" is added, titles with poor sales prospects cannot generate enough margin to cover their fixed costs, so they never get made in the first place. 

Ability to Capture Cross-Side Effects: Your giveaway will be wasted if your network's subsidy side can transact with a competitive network's money size. This was Netscape's mistake. Netscape gave away its browsers to individuals in hopes of selling Web servers to companies operating web sites. But web site operators didn't have to buy Netscape's servers in order to send web pages to Netscape's big browser user base; they could easily buy a rival's web server instead.

Output Costs: Don't subsidize the product when each unit has appreciable costs. If a strong willingness to pay from the money side does not materialize, a giveaway with high variable costs can quickly rack up large losses. FreePC learned this lesson in 1999 when it provided Compaq computers and internet access at no cost to consumers who agreed to view internet ads that could not be minimized or hidden. Not surprisingly, few marketers were eager to target consumers who were so cost conscious. The decision is much simpler when the product subsidized is a digital good such as a Google web search, where the marginal cost of serving an additional user web search costs Google nothing.

Value Added: Even though Apple's Mac platform always commanded a premium from consumers, Microsoft was a winner that essentially monopolized the desktop operating system market. Desktop customers were attracted to Microsoft's Windows operating system because of the large number of applications that were only Windows compatible. This came about partly due to Apple's missteps and partly Microsoft's foresight. When Mac was launched, Apple's grave error was to extract rent from the software developers who developed applications for the Mac operating system by charging them $10,000 for Mac's software development kit (SDK). In contrast, Microsoft was smart enough to give away the Windows' SDK for free. By the time Microsoft went to anti-trust trial, Windows had six times as many applications as Mac!

Interfering same-side effects: Sometimes it makes sense to exclude certain users from your network. For example, many auto part manufacturers, concerned about downward pricing pressure, refused to participate in Covisint, a B2B exchange organized by auto manufacturers. Covisint stalled, as did many B2B exchanges that failed to attract enough sellers. In the face of high negative same-side network effects, network providers should consider granting exclusive rights to single user in each transaction category - and in exchange extract high concession for this rent. The network provider must also ensure that sellers do not abuse their monopoly positions; otherwise, buyers will not be attracted to their platform. 

Marquee Providers: The participation of "marquee users" can be especially important for attracting participants to the other side of the network. A platform provider can accelerate growth if it can secure the exclusive participation of marquee users in the form of commitment from them not join rival platforms. For many years, this kind of exclusive arrangement was at the core of Visa's marketing campaigns - remember ads that said "...and they don't take American Express"


Microsoft learned the hard lesson of not to upset your platform's marquee customers when Electronic Arts (EA) - the largest developer of video games and thus a major potential money side user of Microsoft Xbox platform - refused to create online, multiplayer versions of its games for Xbox Live service. EA objected to Microsoft's refusal to share subscription fees from Xbox Live, among other issues. After an 18 month stalemate, EA finally agreed to offer Xbox Live games. Even though terms of the agreement weren't disclosed, you can bet that they were generously tilted in favor of EA.

Now that we understand the economics of two-sided markets, I'll describe Dr. Alstyne's application of these principles to the evolving business of newspapers in part II of this article to follow in the next few days. Your comments are always welcome. Feel free to email me at rgosalia at gmail dot com.

References:
  • Information Business Models & The News: When Free Works and When it Doesn't, Marshall Van Alstyne, UC Berkeley Media Technology Summit 2009.
  • Strategies for Two-Sided Markets, Thomas Eisenmann, Geoffrey Parker, Marshall Van Alstyne, HBR


Sunday, November 20, 2011

Fundamentals of Value Creation

This section is heavily borrowed from the book "Valuation: Measuring and Managing the Value of Companies". In my opinion, this book has one of the clearest explanations on the drivers of value creation for a company. I say this after reading many books to try to understand this topic. At close to 800 pages, this is not an easy read, but if you are into this kind of thing, I promise it is worth the effort. 

Consider the following two hypothetical companies Value and Volume, whose projected revenues and earnings are identical. Both companies earn $100 million in year 1 and increase their revenues and earnings at 5 percent per year in all future periods, so their projected earnings are identical. Assume that shares outstanding for both companies are the same, so projected EPS for both are also identical. Here is a question - are the two companies' values also the same, or in technical terms, do they deserve the same P/E multiple? The investment community's fixation with EPS growth and P/E multiple would make you believe it to be true, but let me dispel this myth here.

Future growth does not come for free. Both companies have to reinvest a certain percentage of their earnings for the year to achieve future growth. Let's assume that company Value has to invest only 25% of its earnings back into the business but Volume has to reinvest back 50% of its earnings to achieve the same rate of growth as company Value. Thus, company Value creates higher cash flows (Earnings - Investments into the business for future growth) relative to company Volume. 


What remains for the shareholder are these streams of cash flows that she can expect to earn in future periods (through dividend payments for instance). Since "a bird in hand is worth two in the bush" you discount back (using the company's cost of capital) these future expected streams of cash flows to the current time and sum them up to get the intrinsic value for these two companies. Assuming that the cost of capital for both companies are the same, since company Value creates higher cash flows it is more valuable and deserves a higher P/E multiple than company Volume even though both have identical projected EPS' in future periods.

I can't tell you how often I listen to analysts saying "this company trades at 18x P/E and hence it is not cheap, look at this other company that trades at 10x P/E it is much cheaper". In an ideal world where all companies are required to put in same percentage of investment to achieve same rates of future growth, it makes sense to make these types of comparisons, but otherwise it is totally nonsensical.

Company Value achieves 5% of Growth each year by investing back 25% (also known as Investment Rate) of its earnings each year. The ratio of Growth / Investment Rate is known in the financial literature as ROIC (Return on Invested Capital). Thus, Value's ROIC is 20% and Volume's ROIC is 10%. 

Let's look at the valuation matrix for a company that earns $100 million in year one, has a long-term growth rate of 2% to 4%, ROIC of 10% to 16%, and a cost of capital of 10%.


A few observations - (i) the blue column shows that growth has no effect on value when ROIC is same as cost of capital, (ii) the two green cells show that a company with lower growth rate but higher ROIC can be just as valuable as one that has higher growth but lower ROIC, and (iii) the red cell shows that any growth below ROIC destroys value. 

With this new (and correct) way of looking at a business, you will find the constant touting of EPS growth for such and such a company on CNBC to be completely worthless information, especially since CNBC does not talk about ROIC or cost of capital for the business.

Let's talk about how I calculated the valuation matrix above. First, I need to introduce a few new terms. 
  • NOPAT (Net Operating Profit less Adjusted Taxes): represents profits generated from company's core operations after subtracting the income taxes related to the core operations
  • Invested Capital (IC): represents the cumulative amount the business has invested in its core operations - property, plant, and equipment, and working capital
  • Net Investment is the increase in investment capital from one year to the next
  • Free Cash Flow (FCF): is the cash flow generated by the core operations of the business after deducting investments in new capital. So, FCF = NOPAT - Net Investment
  • Return on Invested Capital (ROIC): is the return the company earns on each dollar invested in the business. So, ROIC = NOPAT / Invested Capital. ROIC can also be defined as the incremental return on new or incremental capital. However, for now we assume that both are the same. If not, then the later definition is known as RONIC (Return on New Invested Capital). 
  • Investment Rate (IR) is the portion of NOPAT invested back in the business. So, IR = Net Investment / NOPAT.
  • Weighted average cost of capital (WACC) is the return that investors expect to make from investing in the enterprise and therefore the appropriate discount rate for FCF.
  • Growth (g) is the rate at which NOPAT and cash flow grow each year. Investing the same proportion of NOPAT each year also means that the company's free cash flow grows at rate g.
Since company's free cash flow grows at a constant rate g, we can begin valuing the company by using the well-known formula for perpetual growth:

Enterprise Value = FCF / (WACC - g)  .........(1)

Next, lets define FCF in terms of NOPAT and IR.
FCF = NOPAT - Net Investment =>
FCF = NOPAT - NOPAT * IR   =>
FCF = NOPAT * (1-IR) ..............(2)

In the section on Value vs. Volume, we had seen that 
ROIC = g / IR =>
IR = g / ROIC ............(3)

so putting equation (3) and (2) in (1), you get
Enterprise Value = NOPAT (1 - g/ROIC) / (WACC - g)

If you put ROIC = WACC in the above formula, you get Value = NOPAT / WACC, a formula that is independent of g as we had seen in the blue column of the valuation matrix. 

If you divide by NOPAT on both sides, you get:
Enterprise Value / NOPAT = (1 - g/ROIC) / (WACC - g)

The Enterprise Value to NOPAT ratio (similar to the ratio used in Joel Greenblatt's ratio EV/EBIT but its pre-tax) is a more meaningful way of thinking about the appropriate multiple for a business instead of the usually quoted P/E multiple. As you can see the key drivers of this multiple are long-term growth rate for the business, ROIC, and the cost of capital. 

Lets apply this to one of the businesses I own today - MasterCard. I expect MasterCard to grow at 15% to 20% for the next 5 years and do it at a very high ROIC of 40% to 50%. However, this cannot last forever. Growth rates slow down as markets get saturated and ROIC goes down as opportunities to invest capital go down. It seems unlikely that new competition can come in and start competing with MasterCard in the foreseeable future for a long time (for reasons I will not go into here, but you can look at my MasterCard write-up from December 2010). Thus, once the fast growth period ends, I expect MasterCard to be able to continue growing at least 1% to 2% above inflation of 2% (due to pricing power in absence of competition) and continue to do it at ROIC of 15% to 20%. I use 10% as the WACC for MasterCard. Plug this into the formula, you get a multiple of 11x to 13x of 2016E NOPAT. Since NOPAT can grow at 15% to 20% in the 5 years from 2012-2016, 2016E NOPAT will be at 2x to 2.5x of 2011 NOPAT. Hence, the fair value of MasterCard is between 22x to 30x of 2011 NOPAT + sum of free cash flows generated for the years 2011 through 2016 discounted to present (which we'll ignore for simplicity sake). When I purchased MasterCard in Dec 2010, it was trading at 14.5x of 2010 NOPAT. It's up 60% from my purchase price and today it is trading at 19x 2011 NOPAT. 

Let me give you another example. For the period from 1968 to 2007, net income at the pharmacy chain, Walgreens, grew at 14% annually and it was among the fastest growing companies in the United States. During this period, the average annual shareholder return (including dividends) was 16%. Now, contrast this with performance at the chewing gum maker Wm. Wrigley Jr. Company during the same period. Wrigley's net income during the same period grew much slower at about 10% a year, but the average annual shareholder return of 17% a year was higher than at Walgreens. The reason Wrigley could create more value than Walgreens despite 40% slower growth was that it earned a 28% ROIC, while the ROIC for Walgreens was 14% (which is quite good for a retailer).

Next time you hear the words "this company is trading at only 10x P/E, it must be cheap. Or this company that is at 18x P/E must be expensive", I urge you to think about this article. In all likelihood the conclusion may be the correct one, but think about the business' ROIC and what about its structure causes it to have a high (or a low) ROIC before drawing that conclusion.