Saturday, September 11, 2010

Noble Corporation: Business Analysis & Valuation

Business Overview:
Noble Corporation is a contract oil and natural gas drilling company. Its fleet consists of 62 mobile offshore drilling units (excluding additions from the recent Frontier Drilling acquisition). Shown below is the latest status of its fleet: FleetCount Noble Corp has a long history of navigating well through difficult industry conditions and delivering good returns on capital and operating margins.  HistoricalPerformance Also, compared to its competitors, Transocean (RIG), Ensco (ESV), Diamond Offshore (DO), Rowan Companies (RDC), Pride International (PDE), and Atwood Oceanics (ATW), Noble is among the top performers based on the metrics below: PerformanceComparision

Business Analysis:
Operating revenue for Noble and other contract drilling companies depends on drilling activity by exploration and production (E&P) companies which in turn depends on the outlook for oil prices. In the last three years, crude oil prices have gone through a wild ride causing drilling activity to peak and then to fall off very rapidly. The industry uses two metrics to evaluate the key drivers for revenue:
(i) Average Day Rates:
AvgDayRates
(ii) Average Utilization:
AvgUtilization


Jackups Segment:
Day rates have been coming down as drilling activity has slowed. Also, during the peak of the cycle, contract drillers around the world ordered a record number of new Jackups. These are also known in the industry as “being built on speculation”. These newbuilds are expected to flood the market starting 2010. Most of these newbuilds are uncontracted and thus are expected to put tremendous pressure on day rates for the resetting Jackup contracts for Noble Corp as well as its competitors. Shown below is the data for Jackup Market (Data from RigZone’s 2010 Jackup Market Outlook):
JackUpMarket2010
Jackup day rates for Noble Corp were lower in 2010 H1 than for the industry going into 2010. This trend wasn’t specific to Noble Corp, but was evident for all other competitors too – mostly because of the oversupply conditions in this market.

There are factors other than supply/demand that determine “day rate” for a specific rig in a contract. To name a few, factors such as age of the specific rig, high spec capabilities, the contractor’s track record, operator needs and relationships, and specific rig’s maintenance and performance records also play some role in the pricing equation. Although the average age of Noble’s fleet is 27 years old, it has “rebuilt” (made substantial improvements to) a majority of them. The average age of its Jackup fleet taking this into consideration is 13 years. Ensco has the youngest Jackup fleet (in the same sense) in the industry with an average age of 9 years. We can compare metrics for Ensco’s Jackup fleet to that of Noble to get a sense of the difference (there isn’t much):
VsEnsco

The other factor that helps demand a premium in day rates in normal market conditions (roughly balanced demand/supply) is high spec capability.
HighSpec

With the overhang in supply in the current market conditions, it might be an exaggeration to say that the older and lower spec rigs in the industry will be completely marginalized, but it is likely that these units will face more day rate pressure than the high spec, newer units. Amidst fierce competition for work, owners of higher spec units have the option to step down and compete for contracts with the lower spec rigs, potentially forcing some lower spec rigs to keep day rates repressed to stay active. A potentially mitigating factor to note here is that newly built rig owners, especially unestablished rig owners building rigs on speculative basis, have higher day rate hurdles due to financing costs in order to earn acceptable margins.Later in the valuation section, I will use the economics described above to roughly measure its impact on Noble’s Jackup fleet. 

Before we move on to examining the other segment for Noble, let’s look at the current contract status for its Jackup fleet
JackUpFleetStatus
As you can see, most of the contracts expiring in 2010 are in the Mexico region. In fact, all the rigs in the Mexico region are currently contracted to Pemex, Mexico’s state owned petroleum company. In a difficult market like today, it is concerning that these rigs could be out of work for some time. Also, to add to these difficulties, Pemex originally submitted a tender with age restrictions that would have ruled out Noble Corp’s Jackup fleet. However, very few bidders showed up, causing Pemex to lift this restriction. Subsequently, Pemex also submitted its proposal to the finance ministry to up its budget by 54%. As per Noble, in its Q2 call, Pemex may be in the market for another 21 rigs in Feb 2011 because of this budget increase. This news improves prospects for Noble’s expiring contracts in this region lifting some of the near-term concerns relating its expiring contracts.

Semisubmersible segment:
Day rates for the semisubmersible segment have gone up, despite the fall of oil price from its peak. Also, its utilization has stayed in the 90% + range. This trend is not specific to Noble Corp, but is evident industry wide indicating tighter supply. However, since the Deepwater Horizon accident, not only is the short-run outlook for deepwater drilling in the Gulf of Mexico is grim, but the long-term global impact is yet to be fully understood. This uncertainty in my opinion is what creates the opportunity to invest in Noble Corp. Let’s examine Noble Corp semisubmersible fleet:
SemisubsStatus
As you can see from above, only one operator (Anadarko) has terminated contract so far based on force majeure. This termination is currently in dispute, and revenue recognition is being deferred in the current financial reports. Also, as part of the Frontier acquisition, Shell agreed to support Noble during the Gulf moratorium.  The agreement let Shell suspend the rig contracts of any rig operating or anticipate to operate in the Gulf during the moratorium, if needed. In exchange, Noble will continue to earn a reduced day rate that will cover its operating costs and allow the rig to be quickly returned to duty. The term of the contract will be extended at original contract day rate to reflect any suspension period. This reduces to a large extent the uncertainty of force majeure for its rigs operating in the Gulf.

Now that BP has capped its oil well, the possibility of extending the moratorium beyond Nov 2010 is much smaller. One of the most likely outcomes is stricter regulations. As an example, drilling contractors may be required to upgrade their fleet to meet with new minimum standards for blowout preventers. The older rigs may need to be redesigned to make space for such blowout preventers rendering them to undergo costly upgrades or possibly make them obsolete. Such a requirement would be a boon to contractors that have a younger fleet, thus creating a competitive advantage for them. In the last quarterly call, the CEO of Noble Corp commented that the cost of upgrading its fleet to meet these requirements are very manageable – “on a per rig basis, we are talking millions not tens of millions of dollars”.

The other possible outcome is a permanent shutdown of deepwater drilling in the Gulf. In such a case, Noble and other contractors in the US GOM would be looking for work elsewhere for its semisubmersibles. Such a scenario will cause the economics of day rates for the Semisubmersibles to be very similar to those in the Jackup segment.  Note that offshore US GOM accounts for 30% of US produced crude oil (Source: EIA special report US GOM fact sheet). As per 2006 MMS Estimated Oil and Gas Reserves in US GOM report, most of the remaining proven reserves are in water depth >1500' (considered as deepwater). Also, offshore drilling activity provides major employment for the surrounding states. Given all the above factors and that the BP oil well is now capped, this draconian outcome seems unlikely. Although difficult to quantify, it seems less than 10% probability for such an outcome.

Frontier Acquisition:
Noble recently bought Frontier Drilling. It was a cash transaction for $2.16B. Noble financed the transaction with a combination of cash on hand, and new long-term debt. Noble estimates total debt to go up to $3 billion (currently at $751 million) and the debt/capital ratio to go up to 28% (currently at 10%). Management thinks it can pay off debt in 3 years if it wants to, and the increase in leverage is very manageable. Earnings and cash flow are expected to be accretive starting 2011.

As per analyst estimates at Morningstar®, the acquisition was done at Frontier’s fleet replacement cost and 5x EBITDA. Frontier was facing debt covenant violations in light of potential loss of earnings from the US GOM force majeure termination of one of its rigs. Noble took advantage of Frontier's distress, by using its strong balance sheet to make this acquisition.

As part of the transaction, Noble has added three dynamically positioned drillships, two conventionally moored drillships, one deepwater semisubmersible rig, and one dynamically position FPSO vessel. All of these are already under contract. Also, Noble netted $2 billion in backlog (which is great given that it only paid $2.16 billion). Since Frontier’s 95% of this backlog is with Shell, it agreed to various agreements for Noble’s existing fleet. In addition to the agreements related to its contracts in US GOM described in an earlier section, Noble signed a 10 year contract with Shell for the Globetrotter, which is due to be delivered in the second half of 2011. As per the contract, day rate for the first five years will be $410,000. During the later five years, day rates will adjust based on market rates for such rigs every six months. Shell also agreed to similar terms for a second ultra-semisubmersible rig to be delivered in 2013.

The combined impact of the Frontier acquisition and the agreements with Shell increases Noble’s backlog to $12.9 billion from $6.9 billion previously, second only to Transocean's backlog. While much of the backlog is scheduled in the second half of the decade, the increase is substantial. Another point to note is that Shell prefers to form a relationship with an established player like Noble at higher day rates rather than a marginalized player with newer rigs and lower day rates. Also, it shows that Shell was willing to commit to deepwater for another decade even as the oil spill accident was playing out.

Valuation:
Valuation 

We estimate the earnings power of Noble Corp (excluding accretion to earnings due to the Frontier acquisition) using a worst-case (10% chance), mid-cycle (80%), and peak-cycle (10%) scenario. The details of this estimation are shown in appendix.
EarningsPower

Noble traded at a PE ratio of 12-14x in 2006-07. Then, with the onset of the global recession, PE ratio was compressed to 4x. Oil prices recovered but uncertainty remained due to the BP Deepwater Horizon accident, Noble traded at 6x. In the longer-run, Noble ought to trade at 8-12x to reflect the growth characteristics of  deepwater drilling. Shown below is a sensitivity matrix for Noble’s stock price.
Sensitvity
In the worst case, the downside risk is 36% from the current price (32.6$ on Aug 13, 2010). In the most likely outcome, the upside is 70% (mid-cycle scenario with a PE ratio of 10x). Note that the above is estimated without taking into account the Frontier acquisition.

Appendix: Noble Corp’s Earnings Power Estimate 

Assumptions used for the estimate:
 Assumptions

Given the above assumptions, we can estimate the average day rates and utilization for the four segments:
Estimate-1

The above give us revenue estimate for each segment under the various scenarios. To estimate earnings power, we need to estimate operating margin for the three scenarios. For peak-cycle, use the highest margin that Noble has achieved in 2007-2009. For mid-cycle, use the average of 2006-2009. For worst-case, use the average of last 10 years. The operating margin in this case is much lower than the mid-cycle scenario, but it models Noble’s costs going up dramatically.
Estimate-2

Disclosure: The author has a long position in NE. This is not a recommendation to buy or sell any security. This article is for information purposes only.

Thursday, September 9, 2010

Value Investors: The “Cockroaches” of Finance

Why I am talking about cockroaches on a finance blog? I hate cockroaches. They are top in my list of disgusting and obnoxious insects. Despite that, they are the topic of the discussion today because they have admirable risk-management skills, as noted by Richard Bookstaber in his book “A Demon of Our Own Design.”

Cockroaches are ancient insects that have existed very successfully, relatively unchanged, for at least 250 million years. This means that they have inhabited earth 100 times longer than humans and predated the dinosaurs by about 15 million years. They have survived through many unforeseeable changes – extinction of dinosaurs, ice age and other catastrophic climactic changes, and changing predators that have come and gone over the course of its lifetime.

DemonOfOurOwnDesign Richard Bookstaber points out that “Its not only remarkable that the cockroach has survived so long, but it has done so with a very basic and somewhat suboptimal mechanism. Its defense mechanism is limited to moving away from slight puffs of air, puffs that might signal an approaching predator. It ignores a wide set of information about the environment – visual and olfactory cues, for example – that one would think an optimal risk management system would take into account. The rule that cockroach obeys is so simple that it depends on its giant fiber nervous system; it is a reaction that does not need to be filtered through the brain, but rather goes directly from the sensory hairs that detect the puff of air to the thoracic ganglia controlling its leg motion.”

Furu He further contrasts the extremely coarse risk management structure of the cockroach with that of the furu, a once-dominant fish in Lake Victoria in the middle of Africa. “The furu is a good example of how a specialized creature can be defeated by unanticipated environmental changes. Lake Victoria is the world’s second largest freshwater lake, size of Ireland, in east-central Africa. Even though it is huge, it is relatively shallow with an irregular coastline  of countless inlets and swampy bays. Living in protected isolation in this vast and varied habitat, the small perch like furu specialized to a remarkable degree, diversifying from a single species over the relatively brief 12000-year life of the lake to at least 300 species, ranging in size from 4 to 12 inches. There are furu that survive as scavengers living off of the organic waste of the lake bottom; algae scrapers that feed off of shoreline rocks; snail crushers that have developed long teeth to pull the snail out before it can fully retract into its protective shell; larvae eaters that sift insect larvae out through mouthfuls of mud; prawn eaters that inhabit the deeper waters where the prawns live; and “child eaters” that eat the newly hatched child of other furu just after they are released from their mother’s mouth, or in some cases by first ramming the mother to dislodge the eggs from her mouth.

For the biologist, the furu of Lake Victoria rival the finches that Darwin studied in the Galapagos Islands. In the summer of 1954, the lure of the lake to the naturalist changed forever by the actions of a Kenyan game fisheries officer with a bucketful of Nile perch.

NilePerch

Unlike the diminutive furu, the Nile perch can weigh upwards of 100 pounds. In the mid 1950s, the fish was introduced to other African lakes with spectacular results: Commercial fish production rose tenfold in just a few years. But these other lakes contained species of fish that had time to adapt to the Nile perch or had habitats where the Nile perch did not tend to go. Neither of these conditions turned out to be the case in Lake Victoria.

In the two decades following the initial stocking of Nile perch in Lake Victoria, naturalists who were following the furu found that they were increasing pulling Nile perch out of their nets. Soon the only place they came across the furu was in the stomachs of the predatory Nile perch. It seems the furu did not know what hit them. Defenseless and apparently clueless to the voracious predator that had been unleashed in their midst, they were rapidly becoming extinct. But their impending extinction was not the result of natural selection based on fitness in the usual sense; they were diverse and suited for almost every conceivable element of the Lake Victoria ecology.There was, however, one component of behavior where this was not so, a component that had not mattered at all in the thousands of years they had inhabited the lake but that made all the difference once the Nile perch was introduced. With the exception of a few of the insect- and snail-eating species, the furu at some point in their life cycle move out of the littoral areas and head for the open waters. Because it is such a large fish, the Nile perch tends to stay in deeper waters, so the furu fish that stay near the shoreline, inlets, and rocks might go their whole lives without running into one. For Lake Victoria, that represents a lot of secure real estate. But the furu had never had any evolutionary need to distinguish between the shallow coastline and the deeper waters. This did not represent a failure of fitness or an inability to adapt to its environment. Its path towards extinction was just a result of the dumb luck that someone had introduced an alien species into its waters.

The cockroach and the furu are two of the many examples in biology that illustrate the benefits of coarse behavior and the perils of fine-tuned behavior in reacting to a broad range of natural uncertainty. The coarse response, although suboptimal for any one environment, is more than satisfactory for a wide range of unforeseeable ones. In contrast, an animal that has well-defined and unvarying niche may follow a specialized rule that depends critically on that animal’s narrow perception of the world. If the world continues on as the animal perceives it – with the same predators,food sources, and landscape – the animal will survive. If the world changes in ways beyond the animal’s experience, the animal will die off. Precision and focus in addressing the known comes at the cost of reduced ability to address the unknown.”

ValueInvesting To carry Bookstaber’s biological case study into the capital markets, value investors are the “cockroaches” of the investment world. They eschew leverage, invest only when the price is cheap in securities that have sufficient collateral. Just like the cockroach, their behavior is coarse and suboptimal, especially in rising markets. But, these cockroaches can and will survive through many catastrophic changes.

The furu, on the other hand, is akin to to today’s highly leveraged investor seeking to eradicate risk by fine tuning portfolio using complex math that only a PhD can understand. With risk so theoretically constrained, the “furu” of the investment world use leverage to exploit small market inefficiencies. But, their approach is similar to “picking up dimes in front of steamrollers." Just like the furu, their extinction is assured when an alien predator comes fast and furious in their lake !

LTCM

Shown above is the rise and fall of the hedge fund Long Term Capital Management (LTCM) from 1994 to 1998.

Wednesday, September 1, 2010

Portfolio Update: Semi-Annual Report August 31, 2010

In Feb 2010, I liquidated all my holdings since the market had moved up dramatically and the margin-of-safety for the securities in my portfolio then had narrowed. I now intend to track the performance of my portfolio (since Feb 2010) and make it public on a semi-annual basis. However, this performance is not audited (not because I don't want to, but the costs don't justify at this point). Also, leaving such a paper trail is useful to objectively evaluate oneself on a 3-5 year basis. If I don't track it in writing and make it public, there are good chances that I will either not remember the years of poor performance or selectively choose to forget about it. How many things you thought about 3-5 years ago do you remember today in vivid details? To keep this process as honest as possible, I do not have any other trading accounts outside of the one I am tracking. However, I do invest all my family's and my retirement funds (up to the limit allowed as per tax laws) yearly in mutual funds. I am not yet confident of my investing skills to risk my future retirement.

Do note that this is not meant to be viewed as solicitation of any kind. I am not an investment advisor, and do not have any legal authority to advice you or manage your money.  You should seek a professional investment adviser that can guide you based on your risk profile and goals. As usual, this report is not meant to be used as a recommendation to buy or sell any security.

This report is for the period Feb 1, 2010 (inception) to Aug 30, 2010. Here are the top 10 holdings in the portfolio, holdings by sector and performance history:


I have written extensively on a few of the above holdings: Ensco, Viterra, and Edenred. The investment thesis for each of these holdings at the time of the writing in the past continues to hold true.

[Section added on Sept 2, 2010] Winthrop Realty and Leucadia contributed positively to the portfolio with 18.96% and 6.91% respectively. The stocks in the energy sector - Exxon Mobil, Ensco PLC, and Noble Corp - contributed negatively to the portfolio's performance with -2.5%, -3.07% and -5.85% respectively. Accor and Viterra were marginally in the positive category contributing 1.48% and 2.55%. 20% of the portfolio is in cash and it is yielding close to zero. This is very typical of what I expect from the portfolio going forward. A few names that are working out and a few that need time for Mr. Market to catch up on. Also, with 20% cash, it gives the portfolio a chance to be ready to take advantage of any disruptions in the market to add to existing positions at a lower cost or initiate positions in one of the ideas on "deck" (research completed but not met purchase price target).

The investment philosophy for investing in a security is that of buying at a large discount from my evaluation of its intrinsic value and holding it until most of that value can be realized. This is what 'buy-and-hold' investing really means. People often mistake 'buy-and-hold' to mean holding the stock forever which often translates to holding the stock even when it is grossly overvalued. The only time I will sell a security that is cheap is to buy another security that is even cheaper i.e has a better risk/reward characteristic than the current holding or if I realize that the original reason for the investment no longer holds true. Usually, when I buy the security, its near-term outlook is dire at best - there is a good reason why these stocks are cheap. As it applies to the portfolio today, the holdings are cheap because the market at large is worried about unemployment, deflation, uncertainty about deepwater drilling due to the recent BP oil spill, decreased demand in grains around the world, weather uncertainty etc. However, all these factors are already discounted in the price of the holdings and then some. Having said that, I think that the market will take a few years to realize the intrinsic value of the portfolio holdings. I am willing to be patient. This is why value investors get paid - its really a form of arbitrage. Besides, doing so also helps keep the portfolio turnover low, and the tax bill smaller.

Another characteristic of the portfolio is that of being concentrated. Currently, I hold seven stocks invested in three sectors. My portfolio would fail miserably if an asset allocator looked at it. However, there are a few reasons for doing so. I still have a day job that I like and try to put my best in which leaves me limited time to perform high quality in-depth research. It is physically impossible to do so and have more than 10 securities in the portfolio. Studies have shown that a portfolio needs no more than 10-15 securities to get most of the benefits of diversification. If you have 100 stocks in your portfolio (or your mutual funds has that many stocks) then its really just going to mimic the market. In such a case, you are better off just owning an index fund. The downside to having such a high concentrated portfolio is that a single mistake can cause a big dent. I try to minimize this risk by buying stocks that are selling at a discount of 40-50% relative to its intrinsic value, that have very low levels of debt, do not require continuous access to capital markets, and are not reliant on the mercy of rating agencies (lesson I learnt from the mistakes of the investors in AIG during the crisis).

Even though the portfolio has held up well (+5.45% vs -5.85% for S&P500), there are chances that it may under perform the market in the short run. I have no way of predicting what the market will do in the next six months. However, on a long-run, given the portfolio holdings today, I feel pretty good about it. I do not have a target performance goal (because that may cause one to take unnecessary risks without having adequate payoff), I expect the portfolio to return north of 15-20% for each of these holdings.

My next report will be on March 1, 2011.

Sunday, August 8, 2010

Protect your Investments in a Deflation

MI-BF116_DEFLAT_G_20100806175637 The 'D' word has started to rear its ugly head. Greg Zuckerman at the Wall Street Journal recently reported that some of world's leading investors (Bill Gross, Jeremy Grantham, and David Tepper) are becoming worried about deflation and re-shaping their portfolios to prepare for a possible period of falling prices. Even though value investors don’t invest based on macro forecasts, it is a grave mistake to totally ignore the macro environment, especially by the experts at PIMCO.

I am not a macro economist or have any forecasting abilities. I have zero opinion on whether the environment will be inflationary or deflationary going forward, but in this article, I highlight points by notable investors, Seth Klarman at Baupost Group and Steven Romnick at FPA Crescent, that value investors need to be cognizant about  on how to protect against a possible deflation when selecting individual securities.

Seth Klarman points to the complexity and variability of business valuation in various macro environments in his rare and out-of-print book that sells for $2000 on Amazon, ‘Margin of Safety, Risk-Averse Investing for the Thoughtful Investor’. Here is what he has to say about assessing business value in a deflationary environment:

Seth_Klarman

“In a deflationary environment assets tend to decline in value. Buying a dollar’s worth of assets for fifty cents may not be a bargain if the asset value is dropping. Historically, investors have found attractive opportunities in companies with substantial “hidden assets”, such as an overfunded pension fund, real estate carried on the balance sheet below market value, or a profitable finance subsidiary that could be sold at a significant gain. Amidst, a broad-based decline in business and asset-values, however, some hidden assets become less valuable and in some cases may become hidden liabilities. A decline in the stock market will reduce the value of pension assets; previously overfunded plans may become underfunded. Real estate, carried on companies’ balance sheets at historical cost may no longer be; and undervalued subsidiaries that were once hidden jewels may lose their luster.”

“The possibility of sustained decreases in business value is a dagger at the heart of value investing (and is not a barrel of laughs for other investing approaches either). Value investors place great faith in the principle of assessing value and then buying at a discount. If value is subject to considerable erosion, then how large a discount is sufficient? Should investors worry about the possibility that business value may decline? Absolutely.”

He recommends three responses to protect against the degradation of asset values in a deflation.

“First, since investors cannot predict when values will rise or fall, valuation should always be performed conservatively, giving considerable weight to worst-case liquidation value as well as to other methods. Second, investors fearing deflation could demand a greater than usual discount between price and underlying value in order to make new investments or to hold current positions. This means that normally selective investors would probably let even more pitches than usual go by. Finally, the prospect of asset deflation places a heightened importance on the time frame of investments and on the presence of a catalyst for the realization of underlying value. In a deflationary environment, if you cannot tell whether or when you will realize underlying value, you may not want to get involved at all.”

Further, in his recent lecture at the Ben Graham Center for Value Investing, he gives a specific example of how to evaluate asset values to protect against a “depression-type” environment:

the great depression 2

“We have looked at the debt of auto finance companies. They are captive and their equity does not trade. Right now (2008-2009) the default rates on auto loans have not gone up much. These companies are running an annual loss rate of 2%-4%. That is less than the default rates on houses in many markets and less than high credit card defaults. We don’t have a very good reason for why its so but we suspect it is because (i) very few loans are subprime, (ii) people have a tendency to hold onto their cars if they paid into their loan for a few years, (iii) it is (currently) hard to get new car loans, people don’t have the money, so they don’t let go off their old cars easily, (iv) and, if one has to get to job, they need the car to drive to the job. So, we have reasons to believe that car loans will continue to perform, but we are modeling it to get worse from here on. We ask ourselves what would be a really bad scenario – a base case scenario is for the annual car loan loss rate to quadruple. So, what would happen if it quadruples. The bonds we are buying are fifty cents on a dollar will be still worth ninety to par. Now lets assume that the loan losses go up eight fold, which is armageddon. We would have 40% loss rate over the life of a car loan, 40% loss over the life of a lease, 40% loss on the new cars sitting in dealer showrooms, all of which these companies lend to, but our bonds are still worth sixty to par compared to a our purchase price of fifty. I don’t know how many things you can buy that are worth 20% more than the purchase price even in an armageddon and this is the closest to armageddon we can get. There is no historical precedent to anything close to that ever happening.”

“That is how we are modeling everything. When we look at home residential properties in a housing market that has corrected massively, we assume 20% down in 2009 and 2010 and 10% down in 2011. That will get you down to home price levels in California to 1979 prices, and way past any affordability metric, and will get to mid to high-teens current yields on renting. When you can buy mortgage securities to earn a high return to that assumption, that is the kind of armageddon scenario that makes us excited about investing. You cannot apply that kind of stress test to any bank and buy it. Every bank in the country would be wiped out in those scenarios, though I don’t think it will happen. But, that is the degree of comfort we like and we think we can get in this market, and still buy things to yield high returns.”

Further on, Seth comments on how requiring a larger than usual margin-of-safety causes him to sit on the sidelines in such an environment until it meets his standards of “cheapness”:

“Consider Las Vegas casinos or Hilton hotels. Revenues are down 20% year-over-year. What makes investing in these businesses difficult is that it is hard to tell if revenue are going to be flat one year from now, or if the revenue will be up 15-20%, or worse, if the revenue will drop another 15-20%. When you have that kind of wild disparity, you need to buy to a deteriorating scenario and still get a good return. Its much harder to make those assumptions in certain businesses than in others. Will the volume in Kleenex go down 20% from here on. No, it wont. But, could the revenue at a gambling casino go down another 20%. They could because people don’t have to be at a gambling casino if they don’t want to. So, we try to be really careful, and sometimes its just easy for us to say that we don’t really have an opinion on what may happen. There are other opportunities we could look at, and we’ll just pass on this one.”

Steven Romnick at FPA Crescent commented at the recent quarterly conference call on the large-cap stocks that are considered to be very cheap by many investors -Jeremy Grantham and Bill Miller to name a few.

“Why is the fund sitting on cash instead of investing in high quality large cap stocks that are cheap and have relatively high yields?”

To this, Mr. Romnick responded that the large caps are cheap relative to their historical 10 year averages, but assume that these companies can continue to maintain their margins going forward. This may not be true in a higher than usual inflationary environment or in my opinion a deflationary environment. Cash can be more useful in the future when markets are under distress than to be fully invested in these high quality large caps.

I have looked at the large caps in the past (PG, JNJ, Pfizer, Walmart) and own a long position in Coca Cola and Pepsi, but I do not have an opinion yet on how these companies are priced to various margin compression scenarios. I plan to revisit my position and the other large caps to stress-test for these scenarios.

In conclusion, the important point of this article is that value investors should test individual securities when they are under examination for various stress-case scenarios (like inflationary and deflationary environment, higher than usual margin compression, higher than usual revenue drops etc), and buy only when there is acceptable return to these scenarios. Beware that buying securities by simply looking at historical 10-year data may lead to regret later.

Resources:

Disclosure: The author has his family invested in FPA Crescent. The author has a long position in KO and PEP.

Saturday, August 7, 2010

A Risk-Averse Approach to Emerging Markets

managers_halfThe folks at Tweedy Browne have a solid reputation as value investors. Its history traces back to a brokerage house started in the 1920s that counted Graham and, later, Warren Buffet as some of its primary customers. In 1975, the firm became an investment advisory managing separate accounts and in 1993 it started the Value Fund as a vehicle to bring Graham’s value investing principals to retail investors. They have had an admirable record for their funds over the last 10 and 15 year periods. Also, their letter to shareholders are among the best written ones around and are a must read for all value investors.

In this article, I would like to highlight their approach to investing in the emerging markets. This topic is very relevant today in the light of massive inflows of funds into emerging markets. On Friday, Aug 6 2010, the Wall Street Journal reported that in July 2010 $1.5 billion poured into BlackRock's iShares Emerging Markets ETF (EEM) and $2 billion into Vanguard's Emerging Market ETF (VWO). Now compare this to the fact that Vanguard’s next largest ETF, a fund that invests all over the world except the US, has a mere $5.6 billion in total. Below are some excerpts from their 2009 semi-annual report and 2010 annual report that throw light on how they think about investing in the emerging markets

High profile investors such as Bill Gross and his fellow portfolio manager, Mohamed El-Erian, at PIMCO have opined frequently of late that as deleveraging in the US continues, growth will slow in the West but continue to increase in Asia. Investment capital has again been flowing aggressively back into the emerging markets, driving some valuations in those equity markets to levels that do not make sense to most value oriented investors.

Over the last year (2009), emerging market equities have once again become the darlings of the equity investment world. While mutual fund flows have overwhelmingly been in the direction of bond funds over the last couple of years, the money that has been invested in equity funds has gone largely into international funds, with the vast majority invested in emerging market funds. According to Morningstar, $67.3 billion poured into emerging market equity funds all over the world for the year through January 31 2010. In the US alone, in 2009, a little over $17 billion found its way into diversified emerging market funds which is 40% higher than the flows in any of the last ten years into this category including the high performance years of 2005 through 2007. This flood of new money has had somewhat of a self-fulfilling effect on the performance of these markets with the BRIC index (Brazil, Russia, India and China) up over 85% in US dollars for the year ending March 31, 2010. The Brazilian, Russian and Indian markets are up over 100% during the same period. Investors appear to be not only chasing performance, but also the faster growth in GDP that they feel is relatively assured in these markets. In our opinion, valuations of companies in these markets are now full-to-high and discount extremely optimistic projections of future growth, ignoring the cyclical nature of their most dominant companies and industries. Record inflows and high valuations should raise red flags for investors.

While we love growth and would agree that the economic prospects for a number of these lesser developed countries are quite promising, we simply refuse to pay up for the hope of growth. We will continue to search for value on a company by company basis, and will only commit our shareholders’ capital when we are being afforded a satisfactory “margin of safety,” based on current fundamentals. From our point of view, the prospects for attractive returns continue to be dependent in large part on the price we pay. In a recent article in The Wall Street Journal, Peter Tasker cited an academic study by Jay Ritter of the University of Florida that analyzed 100 years of data from 16 countries that showed that there was no positive correlation between GDP growth and stock market returns – if anything, the correlation was slightly negative. Again, we believe that faster growing countries simply do not offer attractive long-term investment opportunities unless valuations are compelling. Tasker goes on to explain that the companies that end up winning the struggle for survival in the emerging economies may not even exist yet, and cites the fact that there were over 100 different motorcycle companies during the Japanese miracle of the 1950s. “The market leader, Tohatsu, was driven out of business by the cut-throat pricing of a flaky upstart called Honda.”

You might be surprised to learn that our Funds have significant exposure to these faster growing markets. Much of it is indirect and at valuation levels that we believe are more attractive than the majority of opportunities available from most direct investments in these markets. As of September 30 (2009), approximately 10% of the assets in the Tweedy, Browne Global Value Fund were directly invested in what we would describe as the more developed of the emerging markets, (particularly Mexico, South Korea and Croatia) in companies such as Coca-Cola Femsa, Korea Exchange Bank, SK Telecom, and Adris Grupa, among others. Our criteria for direct investment in countries are rather straightforward. We want a political environment with which we are comfortable; we want a fairly well-developed system of contract law with a court system that would allow us to enforce our property rights and seek redress, if necessary; we need reliable financial reporting so that we can value businesses; we would like a forward market in foreign exchange so that we can hedge our currency exposure if we choose to; and finally, we need some mispriced stocks. Absent these basic requirements, from our point of view one is speculating, not investing.

We also have significant indirect exposure to the emerging markets, even those we would be somewhat hesitant to invest in directly. Companies such as Nestle, Unilever, Coca-Cola, Heineken, Diageo, Kone, 3M, and Emerson Electric, among a host of others, derive a surprising amount of their revenue and profits from these faster growing markets. For example, it might surprise you to learn that Heineken has made more money over the last year or so in Africa and the Middle East than it has in the United States where its beer brand is ubiquitous. Its African and Middle Eastern businesses now account for 25% of Heineken’s earnings before interest and taxes (EBIT), second only to the European region, which accounts for 36% of EBIT. Over 50% of 3M and Emerson Electric’s sales occur outside the US today, and approximately 28% and 30%, respectively, comes from emerging markets. 3M’s emerging market segment of its business is growing at a compound annual growth rate of 14%. Diageo, the world leader in premium spirits, generates approximately 35% of its sales from emerging markets. In June, Coca-Cola opened its 37th bottling plant in China, where today Coca-Cola has 52% of the carbonated soft drink market, including the top soda brand, Sprite. Nestle produces over 100 different products that are aggressively sold to the emerging market countries. In 2008, Nestle’s food and beverage sales in the emerging markets achieved over 15% organic growth and accounted for over 30% of its overall sales, or 35 billion Swiss francs. Phillip Morris International, which was spun off from Altria in early 2008, sells cigarettes and other tobacco products in over 160 countries with the bulk of its unit growth today coming from the emerging markets. Its Eastern European, Middle Eastern and African Regions increased its net revenues by 18.2% to reach $7.5 billion in 2008. It has a 41.4% market share in the cigarette market in Turkey, a 35.2% share in the Ukraine, a 29.5% share in Indonesia, 12.3% in Korea, 71% in Argentina, 67.7% in Mexico, 37.6% in Poland, and 39.2% in the Czech Republic. Kone, our long time Finnish elevator company holding, is reported to be the fourth largest player in the Chinese elevator market, which has been growing reportedly at 20% a year for years, and now represents a third of the global elevator market. In addition, there are a number of other companies in our portfolios that derive a substantial amount of their sales from Asian markets, including Jardine Strategic, Unilever, Richemont, and Sika. And the list goes on and on.

In our view, the valuations of these companies remain quite reasonable and are largely free of corporate governance issues, which can plague local emerging market companies. For example, the US-based conglomerate 3M, which we own in the Tweedy, Browne Value Fund, has a publicly traded subsidiary in India called 3M India Ltd., which trades today at approximately 23x earnings before interest, taxes, depreciation and amortization (“EBITDA”), 26x earnings before interest and taxes (“EBIT”), and 40x earnings. This compares to the US-domiciled parent company’s valuation of 17x earnings, 9x EBITDA, and 11x EBIT. From our point of view, the parent company today is practically fully valued despite trading at less than half the multiple levels of its Indian subsidiary. Investing indirectly is often simply a cheaper and safer way to participate in these rapidly growing emerging markets.

Setting aside corporate governance issues for the moment, as we have mentioned in past reports, a bet on these markets is often a highly concentrated bet. The top 5 companies in terms  of market cap in the constituent indices of each of the BRIC countries account for between 31% and 58% of the market cap of the index, and, as previously mentioned, these companies are often cyclical in nature, i.e., banks, oil companies, mining businesses, etc.

Despite these challenges, we remain interested in many of these markets, and we regularly screen for opportunities in those markets. Today, approximately 10% of the net assets of the Tweedy, Browne Global Value Fund is invested in what we would describe as the more developed of the emerging markets, primarily South Korea and Mexico. We are actively screening in Brazil and India today, but uncovering very little value.

Resources:

  • 2009 Semi-annual report, Tweedy Browne, LLC.
  • 2010 Annual report, Tweedy Browne, LLC.
  • Aug 6 2010, Emerging Market Inflows Offer Warning to Financial Advisors, WSJ

Disclosure: The author is a shareholder of Tweedy Browne Global Value Fund (TBGVX).

Wednesday, July 28, 2010

Ensco International: Guilty by Association (with BP)

On a selective basis, controversial situations that are in the news offer the potential for great value investments. These are also known as headline risk situations, since they often beg the question "Don't you read the papers?" But it is precisely because of this uncertainty that many investors automatically sell these companies and create the potential for high returns for value investors. Mr. Market discounts the share price of such companies to reflect a perception of risk much greater than the probable economic risk of the company's long-term fundamentals.

You cannot help but notice that the Gulf of Mexico oil spill has been in the news on a daily basis since the BP Deepwater accident. BP has been the target of criticism, deservedly, since then. The future of BP is definitely at risk, and the extent of its liabilities are hard to estimate. The accident is one of the worst environmental disasters causing extensive damage to marine life and wildlife habitats as well as Gulf's fishing and tourism industries. However, along with BP, many other companies in the sector have been sold off and a few of them indiscrimately. I have taken a long position in one such indiscrimately sold off company, Ensco International. Before I go on, I want to clarify that my investment in this sector does not mean that I do not condone BP's actions or that I am trying to minimize the accident.


Business Overview:
Ensco International is a global offshore drilling contract company. It provides offshore drilling services to the international oil and gas industry. Its operations are concentrated in the geographic regions of Asia Pacific (which includes Asia, Middle East and Australia), Europe and Africa, and North and South America. Its offshore rig fleet included 39 jackup rigs, 4 ultra-deepwater semisubmersible rigs and one barge rig. Additionally, it has 4 ultra-deepwater semisubmersible rigs under construction.

Its business model is very simple. It provides drilling services on a "day rate" contract basis. Under day rate contracts, it provides a drilling rig and a drilling crew and receives a fixed amount for drilling a well. Its customers bear substantially all of the ancillary costs of drilling the well and supporting drilling operations, as well as the economic success of the well. In addition, the customers may pay all or a portion of the cost of moving the equipment and the personnel to and from the well site.

Its strategy has been to focus on the ultra-deepwater semisubmersible rig and premium jack-up rig operations and deemphasize other assets and operations considered to be non-core. It sold off its marine transportation service vessel fleet, all its platform rigs, and all but one barge rigs in the past seven years.

Financials:
The table below shows items from the Income statement for 2007-2009 separated out by the two segments - ultra deepwater semisubmersible for deepwater operations and jackup rigs for shallow-water operations.


The BP oil accident occurred during one of its deep-water operations, and there is significant uncertainty on these kinds of operations. In the case of Ensco, deep-water operations have grown from 4% to 13% of total revenue. In fact, Ensco has invested a large amount of its capital over the last five years growing its fleet to support these operations (from one semisubmersible in 2004 to four in 2009 and four more expected to be delivered in the later of 2010 to 2012). Having said that, as of 2009, majority of its revenue and operating income resulted from its shallow-water operations through its premium jack-up rigs. Also, notice that its gross margins (as well as net) have been compressed since 2007. I will discuss the economics of pricing later in this article.

Lets turn to the cash flow statement for 2007-2009. Ensco has been a strong generator of cash. It has used this cash to (i) add to its fleet (ii) retire debt and return capital to shareholders in the form of dividends and share repurchases and (iii) to make enhancements and maintenance of existing fleet.


One can argue that including rig enhancements in the free cash flow calculation is not strictly necessary, but it is conservative to do so. Such enhancements are required to keep the rigs marketable as "premium" rigs and thus command the margins that Ensco has been delivering.

The company has an extremely strong financial position. This is important in an industry where demand for its products is ultimately tied to the price of oil (rig demand depends on drilling activity which in turn depends on the current and future outlook of oil prices). In a hypothetical deflationary global macro environment where drilling activity could possibly slow down and "day rates" get compressed to historical low levels for an "extended" period of time (although I think this seems unlikely as I explain later), a drilling contract company's financial position could start deteriorating because of a high cash burn rate. In such an unlikely scenario, Ensco is probably the last one to be affected because of its strong position relative to the other players.


In addition to the above, Ensco has off-balance contractual obligations of 482.4 million in 2010 and 644.5 million in 2011-2012 related to construction of new rigs, but it can easily fund these obligations mostly from its  cash & cash equivalents and if needed from its future operating cash flows. It does not need access to capital markets to meet these obligations.

Business Environment:
There are two key metrics - average day rates and rig utilization - that are key to understanding the economics of this business.
  • Rig utilization is derived by dividing the number of days under contract by the number of days in a period.
  • Days under contract equals the total number of days that rigs have earned a day rate, including days associated with compensated downtime and mobilizations. For newly constructed or acquired rigs, the number of days in the period begins upon commencement of drilling operations for rigs with a contract or when the rig becomes available for drilling operations for rigs without a contract.
  • Average day rates are derived by dividing contract drilling revenues, adjusted to exclude certain types of non-recurring reimbursable revenues and lump sum revenues, by the aggregate number of contract days, adjusted to exclude contract days associated with certain mobilizations, demobilizations, shipyard contracts and standby contracts.
Lets look at Rig Utilization and Average Day Rate trends for Ensco from 2005 to June 2010:


These trends were not limited to Ensco but were evident industry-wide. When crude oil and natural gas prices were record high during 2007, drilling activity was at full capacity thus causing industry-wide rig utilization and average day rates to peak. Contract drillers responded to this heightened drilling activity by ordering a large number of new rigs to be delivered in 2008-2010. With the onset of global recession and the fall of oil prices from its record high, drilling activity slowed down abruptly causing an increase in supply of uncontracted rigs thus putting tremendous pressure on day rates. 


Although oil prices have stabilized, incremental drilling activity is expected to stay limited. Also, it is reported that 41 newbuild jackup rigs are currently under construction, over half of which are scheduled to be delivered for delivery during the remainder of 2010. The majority of jackup rigs scheduled to be delivered during 2010 are not contracted. It is unlikely that the market in general or any geographic region in particular will be able to fully absorb newbuild jackup rig deliveries in the near-term, especially in consideration of the existing oversupply of jackup rigs. This may cause average day rates and rig utilization to continue to soften going forward. Semisubmersible rig supply also continues to increase as a result of newbuild construction programs. It has been reported that 29 newbuild semisubmersible rigs are currently under construction, approximately half of which are scheduled for delivery during the remainder of 2010. The majority of semisubmersible rigs scheduled for delivery during 2010 are contracted. But, based on the current level of uncertainty regarding deepwater drilling in the U.S. Gulf of Mexico, it is quite likely that the newbuild semisubmersible rigs will not be absorbed into the global market without a significant effect on utilization and day rates.


Valuation
First we value the company using an income approach starting with reported data for 2009. We then make adjustments to 2009 data to come up with mid cycle, worst case, and peak cycle earnings.


It is evident that in all the above cases, the stock is trading at a very reasonable earnings multiple of 4-10x. Notice that the worst case scenario is quite drastic - cold stacking all semisubmersible rigs and net income from jackup rigs 30% lower than 2009.  This scenario is very unlikely for the following reason - Even though there is near-term uncertainty on deepwater exploration, it seems unlikely that there will be a permanent moratorium worldwide. Deepwater exploration and production are important if the western nations want to reduce their dependence on the OPEC. Also, in the light of the current findings of the BP oil spill, it seems likely that the accident was a result of human error and hence likelihood of such spills can be reduced in the future through stronger regulations on safety measures. But, even if the worst case scenario for deepwater drilling materializes, the worst case scenario for jackup rigs seems implausible. Eventually the day rates for jackup rigs will stabilize to a higher level (2011-2012). So, in the worst case scenario jackup rig utilization and day rates may get compressed for another a year or two, but then stabilize to a higher level. Ensco has the financial strength to live through such a scenario. Besides, such a scenario may get rid of the smaller  contract drillers that took on leverage during the peak of the cycle helping the day rate stabilization process. At the current level (Jun 28, 2010) the margin of safety is large enough to protect our position on the downside even in the worst case scenario. I will not bother analyzing the upside, because "if we take care of the downside, the upside will take care of itself". 

We can also value the company using a book value approach. We start with the book value at the end of 2009 and subtract the goodwill to come up with the tangible book value. This gives us a per share book value of 36.16$. However, property and equipment is accounted for at a historical cost less accumulated depreciation. But, remember that the company has been pouring money from 2005 to 2009 (20% of its total cash flow from operations) for making rig enhancements and maintenance of the rigs. Thus, the book value of property and equipment is somewhat understated. We add the total capital expenditure that the company for enhancements and maintenance to come up with adjusted tangible book value. This gives us a per share book value of 42.57$. 


Here is another evidence to show that the value for rigs is understated on the books. (i) In April 2010, Ensco sold one of its jackup rigs, Ensco 57 built in 1982 upgraded in 2003 max water depth of 300' and drilling depth of 25,000', for 47.1 million but its book value was much lower at 29.2 million. (ii) In March 2010, Ensco sold two jackup rigs, Ensco 50 built in 1983 upgraded in 1998 max water depth of 300' drilling depth of 25,000' and Ensco 51 built in 1981 upgraded in 2002 max water depth of 300' drilling depth of 25,000', for an aggregate of 94.7 million but its book value was much lower at 60.8 million.

Yet, another way to look at company's valuation is offered by the value investor David Einhorn at Greenlight Capital (who owns greater than 5% of Ensco) in his July 16, 2010 letter to shareholders:
Ensco plc (ESV) is an offshore contract oil drilling company operating a large fleet of shallow-water jack-up rigs and a small but new fleet of deep water rigs.  The Deepwater Horizon oil spill and resulting 6-month drilling moratorium in the Gulf of Mexico caused significant share price declines throughout the sector.  ESV was not involved in the horrible accident, which should not materially impact the company’s long-term potential.  ESV has approximately $7 per share in net cash and a tangible book value of $37.50 per share.  The shallow water drilling business, which is unaffected by the drilling moratorium, generates $4.00 per share in unlevered mid-cycle earnings and $8.00 per share in peak earnings.  At the Partnerships’ average cost of $39.41 per share, we appear to be getting the shallow water fleet at a low value and the deepwater fleet (in which ESV has thus far invested over $15 per share to build and should add $2.00 and $4.00 to mid-cycle and peak EPS respectively) for free.  ESV shares ended the quarter at $39.28 each
Credits: Ravi Nagarajan, author of www.rationalwalk.com, brought this idea to my attention through his article Ensco International Profile & Analysis on June 12, 2010.

Resources:
Disclosure: The author has a long position in Ensco (ESV). This presentation is for information purposes only. Do your own research before taking any action regarding any security mentioned in this article.

Sunday, June 27, 2010

Accor's Spin-off Edenred: Business Analysis & Valuation

Introduction
Accor (AC on Euronext Paris) is a French multinational corporation that is a European leader in hotels (Accor Hospitality) and a global leader in corporate services (Accor Services). Accor Hospitality, the Accor hotel branch, has more than 4000 hotels worldwide, ranging from economy to luxury. Through Accor Services, Accor runs service vouchers to over 490,000 companies and institutions worldwide and 33 million users in 40 countries.

In 2009, the company embarked on a major strategic project to demerge its two core businesses, Hotels and Services. The demerger is planned for July 2, 2010, subject to a shareholder approval on June 29, 2010. In this article, I discuss the business and valuation of the Services unit.

Business Overview
The Services unit (to be renamed as Edenred upon demerger) is in the business of providing prepaid services to business and customers. It is the global leader in one of its segment (prepaid benefits products and services) and a leading player in the other segment (prepaid performance improvement products and services). Its business model is one that generates lots of free cash without requiring much capital investment. Here is how it works:


Companies and public authorities purchase vouchers from Edenred at face value plus a service commission and distribute them to the beneficiaries (generally employees). The beneficiary uses the vouchers at face value to purchase goods and services from affiliated merchants (such as restaurants), which in turn redeem the vouchers. Upon redemption, Edenred pays the merchants the face value of the vouchers, less a redemption commission. Between the time the customers pay for the vouchers (most of which are prepaid) and the time the affiliated merchants are reimbursed, the funds (also known as float) are invested and generate financial revenue. To summarize, its total revenues from vouchers include (i) service and redemption commissions, (ii) financial revenue and, (iii) breakage revenue from lost and expired vouchers.

The products and services within the two segments that Edenred operates in are as follows:

  1. Employee and public benefits products and services:
    • Meal and food vouchers enable the employees from having lunch in a restaurant or similar food service establishment of their choice. Employers pay for all or part of the cost of these vouchers, and the amount that the employers pay is tax deductible. The benefit to the employee is tax free. Also, all or part of the face value of the vouchers is exempt from social security contributions for the employer and the employee. 
    • Non food benefits include vouchers that allow employers to pay all or part of the cost of childcare services , household employees, and transport.
    • Public Benefit programs include vouchers that help local authorities and public institutions distribute social aid as per their policy.
  2. Prepaid services to improve performance of organizations:
    • Expense management vouchers enable companies to monitor and control employee business expenses. One of the main products in this category is car voucher which allows employees to purchase fuel for business related traveling.
    • Incentives and rewards include products like gift vouchers.
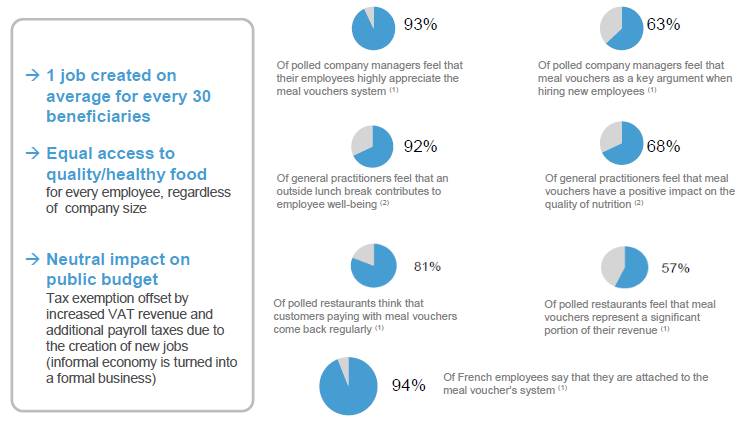
Since the meal and food voucher volume is dominant, I want to describe this product in further detail. Meal vouchers have been around since the 1950s. The meal vouchers came in existence to provide an equalizing effect for the smaller companies. These companies, unlike the larger ones, could not afford to give meal benefits to their employees through a cafeteria of their own. Also, the larger companies that maintained a cafeteria did so because of the tax benefits associated with it. Governments recognized this as an issue and enacted the tax laws to incentivize the smaller companies to provide meal benefits to their employee through meal vouchers. There were obvious economies of scale to outsource the maintenance of such a meal voucher program, and hence the meal voucher industry. 

But, why would a government let go of tax revenues and subsidize such a meal voucher program. There are a few good reasons for doing so. There is evidence that meal vouchers boost the local food and restaurant businesses, thereby creating more jobs, and causing multiplier effects. Also, in countries like Brazil, where majority of the transactions in the retail business are on a cash basis, substantial tax revenues are lost because of unreported revenues to tax officials. Meal vouchers help to move the "informal" economy to a formal one. Thus, the cost of subsidizing the meal vouchers are often offseted. (Fore more information, refer to "Food at Work" listed in the references section).

Competitive Advantages
Edenred is a global leader in the benefits segment with Sodexo being the only other international player in this segment. However, both face some level of competition from local players in each of the markets that they operate in.


The name of the game in the voucher business is issue volume. The higher the issue volume that a particular player has, the wider is its "moat". For obvious reasons, merchants want to accept the vouchers of the top three to four players (by volume). So, most corporate customers want to use one of the three to four larger players (by merchant coverage network). Hence, the network effect. If a smaller player tries to grow its issue volume by cutting down fees, the top players will match the "discount" in fees temporarily in order to dominate in issue volume, and hence throw the smaller player out of the game. Thus, there are very large barriers to steal market share from the larger players. Also, the larger players are sensible enough not to kill each other in a race for market share from each other.

However, the situation in the performance products segment is very competitive. There are many other providers in this business - prepaid solutions specialists, retail banks, payment processing companies, and other program managers like Edenred. Having said that, Edenred has a strong position in expense management products in the countries it operates in (Brazil and Mexico) and so some of the same dynamics described above apply to this product category too. For the other products in this category, the market is fast growing and hence could leave room for Edenred to have market share.

Financial Data
Issue Volume and Revenue:
Issue volume has grown at a 6.8 billion euros in 2003 to 12.4 billion euros in 2009). Even in the recession of 2009, issue volume grew by 5.7% (without accounting for non-recurring impact of Venezuela's currency devaluation).


The 2007-2009 data shows that operating revenue (without contribution of financial revenue from float) as a percentage of issue volume was very stable. 


Issue Volume to Cash Flow Conversion Ratio:
Edenred's business model is a cash flow generating machine. The example below is based on very conservative data from 2009 when unemployment was high and interest rates were low:

Not all the float generated is available to the enterprise. Regulations in certain countries requires that the float be maintained as a separate trust account (called restricted funds), so these funds are not accounted for under free float. These regulations are for France, Hungary and UK and account for 565 million euros.

Historical Free Cash Flow:
Funds from Operations (FFO) has grown 46 million euros in 2003 to 184 million euros in 2009.

To calculate cash flow from operating activities (CFO), we add the variation of float from one year to the next to FFO. Subtracting the capex from CFO gives the free cash flow available to shareholders (FCFE). Shown below is the FCFE data for 2007-2009.


Risks 
For the sake of this article, I will focus on the risks that can cause permanent impairment of business.

1) Changes in laws and regulations governing special tax treatment of Edenred's employee and public benefits products and services:
The employee and public benefit products and services account for 88% of the revenue. Changes in laws and regulations can have a significantly adverse effect on issue volume. As an example, lets use UK and Argentina as an example. Meal vouchers were invented in UK in the 1950s. The tax exemption was set to 15 pence and it was enough to buy a meal then. However, this tax exemption has never been increased, and as a result there are very few participants in the meal voucher system (0.3% of workforce compared to 80% of workforce in Hungary). This shows that tax incentives play a massive role in the sustainability and growth of the voucher business. Recently, Argentina abolished the special tax treatment for vouchers causing a 63% drop in issue volume in 2009. With growing deficits, governments around the world are under constant pressure to grow tax revenue. It is possible that the special tax treatment for the voucher may become a target. Having said that, Edenred's CEO, Jacques Stern, in a recent investor day presentation gave some insight into how to think about this risk. (i) The meal voucher system benefits a mass majority of people, not a special group. Usually, governments target tax exemptions that benefit a special group. Also, a government that is considering such changes faces headwinds from all the stakeholders - unions, employers, voucher providers. (ii) The meal vouchers have shown to cause multiplier effects in the economy. Currently, the reverse of these effects are being experienced in Argentina as a result of meal vouchers being abolished.


2) Transition to electronic format
This could cause a loss in financial revenue due to compression of time lag between issuance and redemption of vouchers. Also, it could cause a loss in breakage revenue of vouchers. However, we can take Brazil as an example where vast majority of the products have transitioned to the electronic format. This has caused issue volume to up, operating costs to come down (due to economies of scale), and added a few new sources of fees that are unique to the electronic card model. So, as per the management team, this risk is not a major threat.

Future Strategy
The management team has set forth 4 key drivers for growth in issue volume of 6-14% (normalized growth rate at local currency level).


The management team will also be selectively looking to do acquisitions to boost growth. In 2007, the firm acquired a B2C gift rewards business (Kadeos). The B2C business is not Edenred's competitive strength and is extremely competitive. In 2009, they wrote down 100 million euro for this acquisition. The CEO Jacques Sterns in the investor day presentation commented about staying within their core strengths moving forward. I think they have learnt this lesson well, and will probably not goof up by paying up for another acquisition.

Valuation
There are at least two ways to value the business. 
  1. Using a price/cash flow multiple from a comparable business
  2. DCF analysis of free cash flow based on various growth scenarios
There are no other public pure players in the same industry as Edenred. Other businesses that are closest to Edenred in terms of business model are ADP and Paychex Inc. Based on the valuation below, the most likely value of the Edenred business (per share) is in the range of 22-28 euros. In the highly unlikely worst case scenario, it is worth at least 16 euros. I have used a conservative terminal value of 2% growth in FCFE based on average worldwide GDP growth and discount rate of 10% due to its wide moat medium risk business. For Edenred's P/CF multiple, I calculate the CF from FCFE using the more conservative projected capex rather than historically lower capex. Also, using ADP and Paychex P/CF multiple gives Edenred the same valuation range as the DCF analysis.

Management and Majority Shareholders
In 2005, real estate private equity firm Colony Capital along with European firm Eurozeo took a large position in Accor. Today, together they own 30% of the company. Also, a new CEO, Gilles Pellison, was brought in to manage Accor. Also, Mr. Pellison happens to be the nephew of Accor's original founder. The founding family and directors jointly own about 2.7% of the company. Southeastern Asset Management owns about 7% of the company through its International Fund. (Scott Cobb, one of the managers of the the international fund, spoke extensively on Accor at its latest shareholder meeting). Edenred's CEO Jacques Stern was first the CFO of Accor and is a superb executor. In conclusion, the management team, the Board, and the large shareholders have their interests aligned.

References
  1. Proposed demerger of the two businesses, Gilles Pellison, Accor
  2. Edenred's supplement to the prospectus, June 11, 2010, Accor
  3. Investor Day Presentation May 15, 2010, Accor
  4. Annual reports 2005-2009, Accor
  5. Food at Work: Workplace solutions for malnutrition, obesity, and chronic diseases. Christopher Wanjek. International Labor Office, Geneva.
  6. Scott Cobb on Accor, Longleaf Funds Shareholder's meeting 2010.

Disclosure: The author owns a long position in Accor (AC.PA) and plans to participate in the spin-off of Edenred (if there is enough margin of safety). This is not a recommendation to buy or sell any security. This presentation is for information purposes only. Do you own research before taking any action regarding any security mentioned in this article.