Wednesday, July 28, 2010

Ensco International: Guilty by Association (with BP)

On a selective basis, controversial situations that are in the news offer the potential for great value investments. These are also known as headline risk situations, since they often beg the question "Don't you read the papers?" But it is precisely because of this uncertainty that many investors automatically sell these companies and create the potential for high returns for value investors. Mr. Market discounts the share price of such companies to reflect a perception of risk much greater than the probable economic risk of the company's long-term fundamentals.

You cannot help but notice that the Gulf of Mexico oil spill has been in the news on a daily basis since the BP Deepwater accident. BP has been the target of criticism, deservedly, since then. The future of BP is definitely at risk, and the extent of its liabilities are hard to estimate. The accident is one of the worst environmental disasters causing extensive damage to marine life and wildlife habitats as well as Gulf's fishing and tourism industries. However, along with BP, many other companies in the sector have been sold off and a few of them indiscrimately. I have taken a long position in one such indiscrimately sold off company, Ensco International. Before I go on, I want to clarify that my investment in this sector does not mean that I do not condone BP's actions or that I am trying to minimize the accident.


Business Overview:
Ensco International is a global offshore drilling contract company. It provides offshore drilling services to the international oil and gas industry. Its operations are concentrated in the geographic regions of Asia Pacific (which includes Asia, Middle East and Australia), Europe and Africa, and North and South America. Its offshore rig fleet included 39 jackup rigs, 4 ultra-deepwater semisubmersible rigs and one barge rig. Additionally, it has 4 ultra-deepwater semisubmersible rigs under construction.

Its business model is very simple. It provides drilling services on a "day rate" contract basis. Under day rate contracts, it provides a drilling rig and a drilling crew and receives a fixed amount for drilling a well. Its customers bear substantially all of the ancillary costs of drilling the well and supporting drilling operations, as well as the economic success of the well. In addition, the customers may pay all or a portion of the cost of moving the equipment and the personnel to and from the well site.

Its strategy has been to focus on the ultra-deepwater semisubmersible rig and premium jack-up rig operations and deemphasize other assets and operations considered to be non-core. It sold off its marine transportation service vessel fleet, all its platform rigs, and all but one barge rigs in the past seven years.

Financials:
The table below shows items from the Income statement for 2007-2009 separated out by the two segments - ultra deepwater semisubmersible for deepwater operations and jackup rigs for shallow-water operations.


The BP oil accident occurred during one of its deep-water operations, and there is significant uncertainty on these kinds of operations. In the case of Ensco, deep-water operations have grown from 4% to 13% of total revenue. In fact, Ensco has invested a large amount of its capital over the last five years growing its fleet to support these operations (from one semisubmersible in 2004 to four in 2009 and four more expected to be delivered in the later of 2010 to 2012). Having said that, as of 2009, majority of its revenue and operating income resulted from its shallow-water operations through its premium jack-up rigs. Also, notice that its gross margins (as well as net) have been compressed since 2007. I will discuss the economics of pricing later in this article.

Lets turn to the cash flow statement for 2007-2009. Ensco has been a strong generator of cash. It has used this cash to (i) add to its fleet (ii) retire debt and return capital to shareholders in the form of dividends and share repurchases and (iii) to make enhancements and maintenance of existing fleet.


One can argue that including rig enhancements in the free cash flow calculation is not strictly necessary, but it is conservative to do so. Such enhancements are required to keep the rigs marketable as "premium" rigs and thus command the margins that Ensco has been delivering.

The company has an extremely strong financial position. This is important in an industry where demand for its products is ultimately tied to the price of oil (rig demand depends on drilling activity which in turn depends on the current and future outlook of oil prices). In a hypothetical deflationary global macro environment where drilling activity could possibly slow down and "day rates" get compressed to historical low levels for an "extended" period of time (although I think this seems unlikely as I explain later), a drilling contract company's financial position could start deteriorating because of a high cash burn rate. In such an unlikely scenario, Ensco is probably the last one to be affected because of its strong position relative to the other players.


In addition to the above, Ensco has off-balance contractual obligations of 482.4 million in 2010 and 644.5 million in 2011-2012 related to construction of new rigs, but it can easily fund these obligations mostly from its  cash & cash equivalents and if needed from its future operating cash flows. It does not need access to capital markets to meet these obligations.

Business Environment:
There are two key metrics - average day rates and rig utilization - that are key to understanding the economics of this business.
  • Rig utilization is derived by dividing the number of days under contract by the number of days in a period.
  • Days under contract equals the total number of days that rigs have earned a day rate, including days associated with compensated downtime and mobilizations. For newly constructed or acquired rigs, the number of days in the period begins upon commencement of drilling operations for rigs with a contract or when the rig becomes available for drilling operations for rigs without a contract.
  • Average day rates are derived by dividing contract drilling revenues, adjusted to exclude certain types of non-recurring reimbursable revenues and lump sum revenues, by the aggregate number of contract days, adjusted to exclude contract days associated with certain mobilizations, demobilizations, shipyard contracts and standby contracts.
Lets look at Rig Utilization and Average Day Rate trends for Ensco from 2005 to June 2010:


These trends were not limited to Ensco but were evident industry-wide. When crude oil and natural gas prices were record high during 2007, drilling activity was at full capacity thus causing industry-wide rig utilization and average day rates to peak. Contract drillers responded to this heightened drilling activity by ordering a large number of new rigs to be delivered in 2008-2010. With the onset of global recession and the fall of oil prices from its record high, drilling activity slowed down abruptly causing an increase in supply of uncontracted rigs thus putting tremendous pressure on day rates. 


Although oil prices have stabilized, incremental drilling activity is expected to stay limited. Also, it is reported that 41 newbuild jackup rigs are currently under construction, over half of which are scheduled to be delivered for delivery during the remainder of 2010. The majority of jackup rigs scheduled to be delivered during 2010 are not contracted. It is unlikely that the market in general or any geographic region in particular will be able to fully absorb newbuild jackup rig deliveries in the near-term, especially in consideration of the existing oversupply of jackup rigs. This may cause average day rates and rig utilization to continue to soften going forward. Semisubmersible rig supply also continues to increase as a result of newbuild construction programs. It has been reported that 29 newbuild semisubmersible rigs are currently under construction, approximately half of which are scheduled for delivery during the remainder of 2010. The majority of semisubmersible rigs scheduled for delivery during 2010 are contracted. But, based on the current level of uncertainty regarding deepwater drilling in the U.S. Gulf of Mexico, it is quite likely that the newbuild semisubmersible rigs will not be absorbed into the global market without a significant effect on utilization and day rates.


Valuation
First we value the company using an income approach starting with reported data for 2009. We then make adjustments to 2009 data to come up with mid cycle, worst case, and peak cycle earnings.


It is evident that in all the above cases, the stock is trading at a very reasonable earnings multiple of 4-10x. Notice that the worst case scenario is quite drastic - cold stacking all semisubmersible rigs and net income from jackup rigs 30% lower than 2009.  This scenario is very unlikely for the following reason - Even though there is near-term uncertainty on deepwater exploration, it seems unlikely that there will be a permanent moratorium worldwide. Deepwater exploration and production are important if the western nations want to reduce their dependence on the OPEC. Also, in the light of the current findings of the BP oil spill, it seems likely that the accident was a result of human error and hence likelihood of such spills can be reduced in the future through stronger regulations on safety measures. But, even if the worst case scenario for deepwater drilling materializes, the worst case scenario for jackup rigs seems implausible. Eventually the day rates for jackup rigs will stabilize to a higher level (2011-2012). So, in the worst case scenario jackup rig utilization and day rates may get compressed for another a year or two, but then stabilize to a higher level. Ensco has the financial strength to live through such a scenario. Besides, such a scenario may get rid of the smaller  contract drillers that took on leverage during the peak of the cycle helping the day rate stabilization process. At the current level (Jun 28, 2010) the margin of safety is large enough to protect our position on the downside even in the worst case scenario. I will not bother analyzing the upside, because "if we take care of the downside, the upside will take care of itself". 

We can also value the company using a book value approach. We start with the book value at the end of 2009 and subtract the goodwill to come up with the tangible book value. This gives us a per share book value of 36.16$. However, property and equipment is accounted for at a historical cost less accumulated depreciation. But, remember that the company has been pouring money from 2005 to 2009 (20% of its total cash flow from operations) for making rig enhancements and maintenance of the rigs. Thus, the book value of property and equipment is somewhat understated. We add the total capital expenditure that the company for enhancements and maintenance to come up with adjusted tangible book value. This gives us a per share book value of 42.57$. 


Here is another evidence to show that the value for rigs is understated on the books. (i) In April 2010, Ensco sold one of its jackup rigs, Ensco 57 built in 1982 upgraded in 2003 max water depth of 300' and drilling depth of 25,000', for 47.1 million but its book value was much lower at 29.2 million. (ii) In March 2010, Ensco sold two jackup rigs, Ensco 50 built in 1983 upgraded in 1998 max water depth of 300' drilling depth of 25,000' and Ensco 51 built in 1981 upgraded in 2002 max water depth of 300' drilling depth of 25,000', for an aggregate of 94.7 million but its book value was much lower at 60.8 million.

Yet, another way to look at company's valuation is offered by the value investor David Einhorn at Greenlight Capital (who owns greater than 5% of Ensco) in his July 16, 2010 letter to shareholders:
Ensco plc (ESV) is an offshore contract oil drilling company operating a large fleet of shallow-water jack-up rigs and a small but new fleet of deep water rigs.  The Deepwater Horizon oil spill and resulting 6-month drilling moratorium in the Gulf of Mexico caused significant share price declines throughout the sector.  ESV was not involved in the horrible accident, which should not materially impact the company’s long-term potential.  ESV has approximately $7 per share in net cash and a tangible book value of $37.50 per share.  The shallow water drilling business, which is unaffected by the drilling moratorium, generates $4.00 per share in unlevered mid-cycle earnings and $8.00 per share in peak earnings.  At the Partnerships’ average cost of $39.41 per share, we appear to be getting the shallow water fleet at a low value and the deepwater fleet (in which ESV has thus far invested over $15 per share to build and should add $2.00 and $4.00 to mid-cycle and peak EPS respectively) for free.  ESV shares ended the quarter at $39.28 each
Credits: Ravi Nagarajan, author of www.rationalwalk.com, brought this idea to my attention through his article Ensco International Profile & Analysis on June 12, 2010.

Resources:
Disclosure: The author has a long position in Ensco (ESV). This presentation is for information purposes only. Do your own research before taking any action regarding any security mentioned in this article.

Sunday, June 27, 2010

Accor's Spin-off Edenred: Business Analysis & Valuation

Introduction
Accor (AC on Euronext Paris) is a French multinational corporation that is a European leader in hotels (Accor Hospitality) and a global leader in corporate services (Accor Services). Accor Hospitality, the Accor hotel branch, has more than 4000 hotels worldwide, ranging from economy to luxury. Through Accor Services, Accor runs service vouchers to over 490,000 companies and institutions worldwide and 33 million users in 40 countries.

In 2009, the company embarked on a major strategic project to demerge its two core businesses, Hotels and Services. The demerger is planned for July 2, 2010, subject to a shareholder approval on June 29, 2010. In this article, I discuss the business and valuation of the Services unit.

Business Overview
The Services unit (to be renamed as Edenred upon demerger) is in the business of providing prepaid services to business and customers. It is the global leader in one of its segment (prepaid benefits products and services) and a leading player in the other segment (prepaid performance improvement products and services). Its business model is one that generates lots of free cash without requiring much capital investment. Here is how it works:


Companies and public authorities purchase vouchers from Edenred at face value plus a service commission and distribute them to the beneficiaries (generally employees). The beneficiary uses the vouchers at face value to purchase goods and services from affiliated merchants (such as restaurants), which in turn redeem the vouchers. Upon redemption, Edenred pays the merchants the face value of the vouchers, less a redemption commission. Between the time the customers pay for the vouchers (most of which are prepaid) and the time the affiliated merchants are reimbursed, the funds (also known as float) are invested and generate financial revenue. To summarize, its total revenues from vouchers include (i) service and redemption commissions, (ii) financial revenue and, (iii) breakage revenue from lost and expired vouchers.

The products and services within the two segments that Edenred operates in are as follows:

  1. Employee and public benefits products and services:
    • Meal and food vouchers enable the employees from having lunch in a restaurant or similar food service establishment of their choice. Employers pay for all or part of the cost of these vouchers, and the amount that the employers pay is tax deductible. The benefit to the employee is tax free. Also, all or part of the face value of the vouchers is exempt from social security contributions for the employer and the employee. 
    • Non food benefits include vouchers that allow employers to pay all or part of the cost of childcare services , household employees, and transport.
    • Public Benefit programs include vouchers that help local authorities and public institutions distribute social aid as per their policy.
  2. Prepaid services to improve performance of organizations:
    • Expense management vouchers enable companies to monitor and control employee business expenses. One of the main products in this category is car voucher which allows employees to purchase fuel for business related traveling.
    • Incentives and rewards include products like gift vouchers.
Since the meal and food voucher volume is dominant, I want to describe this product in further detail. Meal vouchers have been around since the 1950s. The meal vouchers came in existence to provide an equalizing effect for the smaller companies. These companies, unlike the larger ones, could not afford to give meal benefits to their employees through a cafeteria of their own. Also, the larger companies that maintained a cafeteria did so because of the tax benefits associated with it. Governments recognized this as an issue and enacted the tax laws to incentivize the smaller companies to provide meal benefits to their employee through meal vouchers. There were obvious economies of scale to outsource the maintenance of such a meal voucher program, and hence the meal voucher industry. 

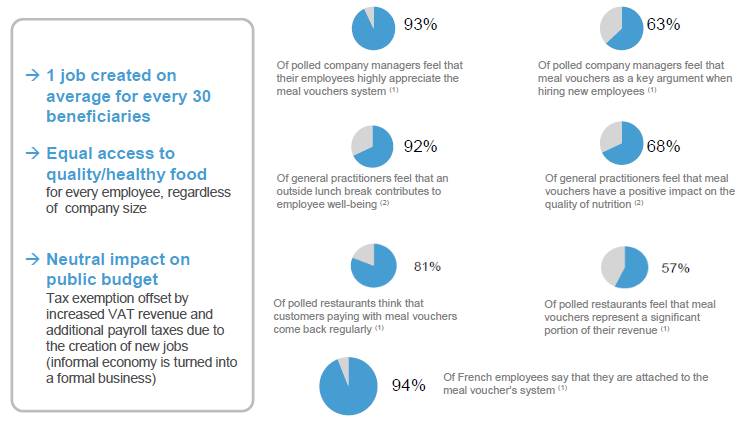
But, why would a government let go of tax revenues and subsidize such a meal voucher program. There are a few good reasons for doing so. There is evidence that meal vouchers boost the local food and restaurant businesses, thereby creating more jobs, and causing multiplier effects. Also, in countries like Brazil, where majority of the transactions in the retail business are on a cash basis, substantial tax revenues are lost because of unreported revenues to tax officials. Meal vouchers help to move the "informal" economy to a formal one. Thus, the cost of subsidizing the meal vouchers are often offseted. (Fore more information, refer to "Food at Work" listed in the references section).

Competitive Advantages
Edenred is a global leader in the benefits segment with Sodexo being the only other international player in this segment. However, both face some level of competition from local players in each of the markets that they operate in.


The name of the game in the voucher business is issue volume. The higher the issue volume that a particular player has, the wider is its "moat". For obvious reasons, merchants want to accept the vouchers of the top three to four players (by volume). So, most corporate customers want to use one of the three to four larger players (by merchant coverage network). Hence, the network effect. If a smaller player tries to grow its issue volume by cutting down fees, the top players will match the "discount" in fees temporarily in order to dominate in issue volume, and hence throw the smaller player out of the game. Thus, there are very large barriers to steal market share from the larger players. Also, the larger players are sensible enough not to kill each other in a race for market share from each other.

However, the situation in the performance products segment is very competitive. There are many other providers in this business - prepaid solutions specialists, retail banks, payment processing companies, and other program managers like Edenred. Having said that, Edenred has a strong position in expense management products in the countries it operates in (Brazil and Mexico) and so some of the same dynamics described above apply to this product category too. For the other products in this category, the market is fast growing and hence could leave room for Edenred to have market share.

Financial Data
Issue Volume and Revenue:
Issue volume has grown at a 6.8 billion euros in 2003 to 12.4 billion euros in 2009). Even in the recession of 2009, issue volume grew by 5.7% (without accounting for non-recurring impact of Venezuela's currency devaluation).


The 2007-2009 data shows that operating revenue (without contribution of financial revenue from float) as a percentage of issue volume was very stable. 


Issue Volume to Cash Flow Conversion Ratio:
Edenred's business model is a cash flow generating machine. The example below is based on very conservative data from 2009 when unemployment was high and interest rates were low:

Not all the float generated is available to the enterprise. Regulations in certain countries requires that the float be maintained as a separate trust account (called restricted funds), so these funds are not accounted for under free float. These regulations are for France, Hungary and UK and account for 565 million euros.

Historical Free Cash Flow:
Funds from Operations (FFO) has grown 46 million euros in 2003 to 184 million euros in 2009.

To calculate cash flow from operating activities (CFO), we add the variation of float from one year to the next to FFO. Subtracting the capex from CFO gives the free cash flow available to shareholders (FCFE). Shown below is the FCFE data for 2007-2009.


Risks 
For the sake of this article, I will focus on the risks that can cause permanent impairment of business.

1) Changes in laws and regulations governing special tax treatment of Edenred's employee and public benefits products and services:
The employee and public benefit products and services account for 88% of the revenue. Changes in laws and regulations can have a significantly adverse effect on issue volume. As an example, lets use UK and Argentina as an example. Meal vouchers were invented in UK in the 1950s. The tax exemption was set to 15 pence and it was enough to buy a meal then. However, this tax exemption has never been increased, and as a result there are very few participants in the meal voucher system (0.3% of workforce compared to 80% of workforce in Hungary). This shows that tax incentives play a massive role in the sustainability and growth of the voucher business. Recently, Argentina abolished the special tax treatment for vouchers causing a 63% drop in issue volume in 2009. With growing deficits, governments around the world are under constant pressure to grow tax revenue. It is possible that the special tax treatment for the voucher may become a target. Having said that, Edenred's CEO, Jacques Stern, in a recent investor day presentation gave some insight into how to think about this risk. (i) The meal voucher system benefits a mass majority of people, not a special group. Usually, governments target tax exemptions that benefit a special group. Also, a government that is considering such changes faces headwinds from all the stakeholders - unions, employers, voucher providers. (ii) The meal vouchers have shown to cause multiplier effects in the economy. Currently, the reverse of these effects are being experienced in Argentina as a result of meal vouchers being abolished.


2) Transition to electronic format
This could cause a loss in financial revenue due to compression of time lag between issuance and redemption of vouchers. Also, it could cause a loss in breakage revenue of vouchers. However, we can take Brazil as an example where vast majority of the products have transitioned to the electronic format. This has caused issue volume to up, operating costs to come down (due to economies of scale), and added a few new sources of fees that are unique to the electronic card model. So, as per the management team, this risk is not a major threat.

Future Strategy
The management team has set forth 4 key drivers for growth in issue volume of 6-14% (normalized growth rate at local currency level).


The management team will also be selectively looking to do acquisitions to boost growth. In 2007, the firm acquired a B2C gift rewards business (Kadeos). The B2C business is not Edenred's competitive strength and is extremely competitive. In 2009, they wrote down 100 million euro for this acquisition. The CEO Jacques Sterns in the investor day presentation commented about staying within their core strengths moving forward. I think they have learnt this lesson well, and will probably not goof up by paying up for another acquisition.

Valuation
There are at least two ways to value the business. 
  1. Using a price/cash flow multiple from a comparable business
  2. DCF analysis of free cash flow based on various growth scenarios
There are no other public pure players in the same industry as Edenred. Other businesses that are closest to Edenred in terms of business model are ADP and Paychex Inc. Based on the valuation below, the most likely value of the Edenred business (per share) is in the range of 22-28 euros. In the highly unlikely worst case scenario, it is worth at least 16 euros. I have used a conservative terminal value of 2% growth in FCFE based on average worldwide GDP growth and discount rate of 10% due to its wide moat medium risk business. For Edenred's P/CF multiple, I calculate the CF from FCFE using the more conservative projected capex rather than historically lower capex. Also, using ADP and Paychex P/CF multiple gives Edenred the same valuation range as the DCF analysis.

Management and Majority Shareholders
In 2005, real estate private equity firm Colony Capital along with European firm Eurozeo took a large position in Accor. Today, together they own 30% of the company. Also, a new CEO, Gilles Pellison, was brought in to manage Accor. Also, Mr. Pellison happens to be the nephew of Accor's original founder. The founding family and directors jointly own about 2.7% of the company. Southeastern Asset Management owns about 7% of the company through its International Fund. (Scott Cobb, one of the managers of the the international fund, spoke extensively on Accor at its latest shareholder meeting). Edenred's CEO Jacques Stern was first the CFO of Accor and is a superb executor. In conclusion, the management team, the Board, and the large shareholders have their interests aligned.

References
  1. Proposed demerger of the two businesses, Gilles Pellison, Accor
  2. Edenred's supplement to the prospectus, June 11, 2010, Accor
  3. Investor Day Presentation May 15, 2010, Accor
  4. Annual reports 2005-2009, Accor
  5. Food at Work: Workplace solutions for malnutrition, obesity, and chronic diseases. Christopher Wanjek. International Labor Office, Geneva.
  6. Scott Cobb on Accor, Longleaf Funds Shareholder's meeting 2010.

Disclosure: The author owns a long position in Accor (AC.PA) and plans to participate in the spin-off of Edenred (if there is enough margin of safety). This is not a recommendation to buy or sell any security. This presentation is for information purposes only. Do you own research before taking any action regarding any security mentioned in this article.

Tuesday, June 22, 2010

Knowing Vs Understanding

Joel Greenblatt is a very successful value investor and has written a popular book called 'The Little Book That Beats the Market'. In the book, Mr. Greenblatt shows the merits of picking a portfolio of 30 stocks using a "magic formula" - buying businesses cheaply that have high earnings yield and high returns on capital. Furthermore, Mr. Greenblatt's firm has done extensive research to show the validity of such an approach.  However, I see grave dangers in relying solely on such a mechanical approach to investing i.e. without understanding the underlying business and the industry dynamics*.

This goes beyond "magic formula" investing. You cannot help but notice that Wall Street's extent of valuation mostly starts and ends with such simplistic valuation metrics. In this article, I want to point out some of the perils of exclusive dependence on the two "magic formula" metrics - (reciprocal of) PE ratio and ROE.

First, I site four examples from Curtis Jensen's Q1 2006 Letter to Shareholders to illustrate how reported earnings and thus the PE ratio can mislead investors.
"Temporarily depressed earnings: To be sure, high PE ratios can be a sign of any number of developments. In many cases, TAM finds itself investing in companies rich in resources, but experiencing weak current business conditions, or in the throes of a severe industry recession. Superior Industries, for example, a leading maker of forged aluminum automobile wheels with a cash rich, debt free balance sheet, has seen its annual earnings per share (“EPS”) drop to less than $1.00 per share in the current period, from peak levels two to three years ago that ranged from $2.50 to $3.00 per share. Competitive conditions have intensified, as customer demand has waned. Management could rather quickly use the company’s existing cash hoard to repurchase large amounts of stock, and thereby boost the reported EPS. Our expectation, however, is that Superior’s management would use much of the company’s existing cash to protect and grow the business, in order to improve the company’s earning power from the currently depressed levels.
Extraordinary investment: Some of TAM’s portfolio companies continue to invest heavily to build their businesses, temporarily depressing reported earnings. Bandag, Inc. sells supplies and equipment used in the retreading of truck tires, and provides related tire management and vehicle maintenance services. In the past year, through an acquisition, its worldwide franchisee network has added a quick service truck lubrication business. Heavy investments in this business expensed for accounting purposes many of its expansion costs; not surprisingly, reported earnings per share in 2005 fell to $2.52, versus the more than $3.00 earned by the company in 2004. Were Bandag management so inclined, it could defer the spending initiatives to the future, and thereby improve current, reported EPS. Such a move would undoubtedly come at the expense of the company’s future health.
Underemployed resources: Consistent with our “Safe and Cheap” investment philosophy, many TAM holdings are temporarily overcapitalized, meaning the management has not redeployed excess capital into the business. NewAlliance Bancshares, a Connecticut-based bank holding company, might qualify as one such example. The company’s current share price, around $14, is arguably pricey relative to current earnings at $0.50 to $0.60 per share. However, the bank has probably twice the equity capital it needs to not only maintain, but to sensibly grow its business. By growing its book of loans and investments, and prudently repurchasing its own stock during the next three to five years, it is not inconceivable that NewAlliance could earn more than $1.20 per share.
Accounting shortcomings: Other companies, likeBrookfield Asset Management, for example, report earnings numbers that bear little relation to the underlying economic value being created through their growing cash flow and asset redeployments. Brookfield’s current PE ratio, which is around 20x, looks rich, but it is largely irrelevant. For example, accounting rules require that the company expense depreciation related to the company’s real estate, hydroelectric power plants and other infrastructure assets. However, that accounting expense largely overstates the amount of sustaining capital required by the business. The result is a reported earnings number that is, in many ways, fictional, and a PE ratio that is artificially high."
Next, I site an example from Amit Wadhwaney's Q3 2004 Letter to Shareholders to illustrate the dangers of focusing on ROE (even though the example described below is one of a financial company, the underlying philosophy is true for most other businesses)
"The experience of one of the Fund’s current investments—Banco Latino Americano de Exportaciones SA (“Bladex”) provides a cautionary example of such a focus on R.O.E.s gone awry. Since its inception in 1979, Bladex was an unusually well capitalized bank set up to finance intra-Latin American trade. For a number of years, notwithstanding the tremendous economic volatility (hyperinflation, currency collapses, etc.) that characterized the region where it operated, the bank experienced an extremely low level of losses and generated R.O.E.s of 12-15%. This represented an adequate level of profitability, except to some investors who felt that its R.O.E. could be improved upon by reducing the capitalization, by returning what they felt was the company’s excess capital to investors and simultaneously increasing the R.O.E., which would reward them with a higher stock price to boot. After a period of lobbying by investors, Bladex returned roughly $100 million to investors, through a special dividend and stock repurchase. While the company was increasing its operating leverage in this manner, it entered corporate lending, a new line of business, which was growing faster than the bread-andbutter trade finance business—albeit it had a considerably greater risk profile.
The rosy period of higher R.O.E.s and earnings growth that was envisioned for the recapitalized Bladex turned out to be short lived. A year later, the financial repercussions from the Argentinian Peso devaluation almost wiped out Bladex’s capital. It was saved by a share issue (which roughly corresponded to the Fund’s entry point), whose size was $134 million––a little bit more than was originally returned to investors. Equivalently, absent the earlier return of capital, the company would have been better capitalized to withstand the Argentinian crisis and a subsequent funding, if necessary, would have been smaller and obtained on considerably more favorable terms. Currently, Bladex has returned to its lower growth but “safer” business of providing trade finance. It is exceptionally well capitalized with a ratio of Tier 1 to risk-weighted assets of 37.8%—a large number by most measures, but this should be viewed in the context of the riskiness of the region where it operates and where balance sheet strength is an absolute necessity to withstand any unforeseen difficulties that might arise.
As this example illustrates, while there is a trade-off in arithmetic terms between the extent of overcapitalization and return on equity, from the Fund’s perspective this can hardly be said to be an acceptable tradeoff, given the potential increase in the riskiness of an investment that can accompany a capitalization that is unable to withstand significant, unforeseen shocks. The Fund is a long-term, buy and hold investor. "
In conclusion, a low PE ratio and a high ROE are neither necessary nor sufficient conditions of a "value" investment. Knowing these numbers only gives you a starting point - the real work is in understanding these numbers.
"You can know the name of a bird in all the languages of the world, but when you’re finished, you’ll know absolutely nothing whatever about the bird... So let’s look at the bird and see what it’s doing — that’s what counts. I learned very early the difference between knowing the name of something and knowing something" - Richard Feynman.


References:
  1. The Little Book that Beats the Market, Joel Greenblatt
  2. Letter to Shareholders, Curtis Jensen Q1 2006
  3. Letter to Shareholders, Amit Wadhwaney Q3 2004
  4. Richard Feynman, Wikipedia
Disclosure: I have investments that are managed by Third Avenue Management. I do not have investments managed using the Magic Formula Investing. This is not a recommendation to buy or sell any securities. Do your own research before investing or not investing in any security mentioned in this article.


*Appendix: The magic formula investing requires that the portfolio be turned over once a year. This is a critical step to make the approach work - since statistically identified businesses may not actually be cheap and high quality businesses. So, by no means, I am saying that magic formula investing does not work. 

Wednesday, June 16, 2010

Viterra: Case Study for Safe and Cheap Investing

Recently, Morningstar interviewed Amit Wadhwaney at Third Avenue Management (TAM) and Wadhwaney discussed one of his Canadian holding - Viterra. This interview piqued my interest in Viterra, and I spent some time digging through the annual reports of Viterra and Wadhwaney’s letters to shareholders to understand his investment thesis. Upon investigation, I found that Viterra fits TAM’s “safe and cheap” investing framework perfectly. In this case study (it is much longer than most articles on this website, but it is a case-study), I want to use TAM’s investment in Viterra to show how safe and cheap investing works and highlight how it differs from other value investing methodologies.

Let’s begin with understanding the elements of a "safe and cheap" investment:
• High quality balance sheet.
• Competent and shareholder-oriented management.
• Understandable and honest disclosure documents.
• Priced at a significant discount from realizable net asset value.

We will come back to these elements of safe and cheap investing as applicable to Viterra, but first let’s understand some key events that took place before TAM invested in Viterra.

1990-2000: The Pool goes Public
Viterra is an agribusiness based in Regina, Saskatchewan. It was formed from the take-over of Agricore United by Saskatchewan Wheat Pool (“Pool”). The Pool had been in operation since the 1920s as a farmer’s co-op, but it decided to go public in the 1990s. The company was undergoing the largest and the most expensive capital expansion in its history at that time and needed the access to capital markets. It got listed on the Toronto stock exchange, but it had a corporate governance structure that was inequitable for the public shareholders since they had no voting rights. The Pool’s board was made up of 16 farmer directors who were elected by the co-operative members, who represented both the 70,000 farm customers as well as the non-voting shareholders. With this dual-class governance structure, raising capital in the equity markets was difficult, and the Pool met its capital needs through the debt markets. But, many of its investments did not succeed and the company was burdened with $550 million of debt.


2000-2005: Financial Troubles and Restructuring
The Board replaced the senior management team and brought in a new CEO Mayo Schmidt. Schmidt had spent 15 years with General Mills’ agriculture business followed by a few years leading the Nebraska-based ConAgra Food’s expansion in Canada. All along, he had been observing Pool’s doomed attempts to grow its business. But, he saw an opportunity in this mess. “It was my view that the Saskatchewan Wheat Pool could be a catalyst for the changes that were necessary to make Canadian agriculture a major player in global food markets”, he said. Also, the Pool’s Board recognized the need for professional expertise, and brought two external Board advisors from the business community to actively participate at the board table. While the Board members did not have the authority to vote on Board matters, they challenged the Board to take the difficult and necessary steps. This led to Schmidt divesting the Pool’s non-core businesses, many close to the board member’s hearts, and reduced the work force by 60%.

Unfortunately, after the initial efforts, the company got hit with two years of draught which eliminated all its earnings so far. Now, its debt reduction strategies came to a halt. With the Pool facing significant debt obligations, Schmidt hit the road to negotiate with the banks and the bondholders. Thankfully, he could convince the lenders to allow Pool to enter a restructuring period to come up with a plan. He nearly saved the Pool from a bankruptcy, but at this point the lenders made one point very clear – they will no longer finance the company without having board representation. Thus, the Board was restructured significantly to match the regulatory governance standards – four members were replaced with outside directors and new positions were created for many of the required functions. Also, Schmidt put forward a restructuring plan to make the company financially viable. To eliminate more than $170 million in future obligations and to once again access the capital markets, Schmidt’s plan was a debt to equity swap. But, this transaction required common shares to have voting rights and the co-operative structure restricted ownership of voting shares to farmers only. Schmidt convinced the farmers, just barely, to relinquish their voting control, turning the Pool into just another corporation. This was followed by a $150 million rights offering whose proceeds were used to retire debt and to support its working capital requirements. Its debt to equity ratio improved from 61:39 a year earlier to 33:67 and total debt declined by 38%.

Having undergone major transformation in its governance structure and financial position, TAM entered the picture. TAM’s International Fund led by Amit Wadhwaney took a position (9,155,750 shares in Q1 2006) in the Pool. Here is Wadhwaney investment thesis: “Following the recent restructuring efforts, we believe Pool now has a sensible governance structure, as well as one of the strongest balance sheets and one of the better networks of operating assets among its peers. Should the industry continue to rationalize, as it has over the last five years, Pool is positioned to not only survive; but, potentially thrive as one of the more efficient operators. Our investment in Pool Common was made at a single digit multiple of operating earnings.”

Now, here is a business that you would have missed completely if you used any traditional measures of value investing in your search methodology. It probably would not have met any of the criteria set by value investors like Brucewald’s earnings power value, Graham’s ten years of earning history (normalized earnings) or the modern version of using ten years of free cash flow history (normalized free cash flow). The Pool had very few years of profitability in its 10 years of operations then and probably no free cash flow. Its debt reduction was mostly due to the asset conversion activities, not earnings capacity. But, TAM invested because it met all the criteria of being a “safe and cheap” investment.
• Clean balance sheet that would be of much higher value to a potential bidder in case the management was unsuccessful at implementing its future plans
• New governance structure and elimination of the dual-class structure as an indication that the management team was shareholder friendly
• Easy to understand business and transparent management that addressed troubling issues.
• Very cheap price relative to (its only two years of positive) operating earnings.

So, here is what happened post TAM’s investment.

2005-2007: The Pool buys Agricore
Only eighteen months after the historic transformation, Schmidt was ready to take the Pool to the next steps. He made a bid for the much bigger Agricore United. Agricore initially dismissed the unsolicited bid from the Pool, which had about half as much in annual sales, and a six-month battle ensued. Schmidt decided to pitch to his investors the potential cost savings of merging operations, raising $920 million that led him close to the cash plus stock deal. TAM participated in the private placement of the subscription. Here is an excerpt from Wadhwaney’s letter to shareholders (Q2 2007): “One of the Fund’s larger investments during this period was a subscription to a private placement of subscription receipts, potentially exchangeable into common shares of an existing Fund holding, Saskatchewan Wheat Pool, Inc. (“Pool”), at a valuation that we considered particularly attractive. These receipts were to be exchangeable into Pool Common in the event that the Pool was successful in its acquisition of one of its rival grain handlers, Agricore United (“Agricore”). The proposed combination of Pool and Agricore is expected to create, by far, the largest grain handling network in the Canadian Prairie Provinces, with the attendant economies of scale that would ensue. Estimates of the percent of the Prairie grain that would be handled by this entity range up to 40%, although this might well, in time, prove to be an underestimate considering that these two companies have between them the most efficient grain-handling equipment in the industry. In addition, the merger will result in the combination of the two largest distributors of agri-products (e.g., seed, fertilizers, herbicides, pesticides, etc.) in the Prairies, enabling the Company to realize further economies in the combined operation. Following the end of the fiscal quarter, the Pool announced that it had been successful in its efforts to acquire Agricore and the subscription receipts were exchanged for Pool Common.”

Further, in his letter, Wadhwaney describes how return to its holdings can be realized due to asset conversion activities. I emphasize this piece because the concept of asset conversion activities is central to “safe and cheap” investing. Martin Whitman, the father of safe and cheap investing, in his Aggressive Conservative Investor book says that analyzing most firms as going concerns using earnings related measures is not appropriate because most firms are involved in asset conversion activities.

In the case of the Pool, the asset conversion activity is that of structural change in the industry. Wadhwaney describes it as follows: “Witness, for example, the above-noted successful tender by the Pool for Agricore; both companies are experiencing the current buoyancy in the Canadian agricultural sector. The tender offer was motivated less by the desire to wring out redundant, unprofitable capacity, but more to realize economies of scale which would be enjoyed by the combined entity, and the complementary nature of the two companies’ asset bases. Further, this would be expected to change the profitability of the industry, both in aggregate and its distribution. Structural change in an industry is one of a number of possible outcomes of resource conversion activities of one or more companies in an industry, which has the potential for consequences which reach far beyond the company (or companies) that engages (engage) in these activities. Periodically, such activities, by one or more in the industry, have the potential to affect the profitability characteristics for the entire industry which, in turn, has an impact upon potential returns of an investment in a company operating in the affected industry. The investee company may, or may not, be a participant in the structural change directly; but, in either case, is likely to be affected by it. Although Fund management does not claim to be able to consistently predict such structural changes in industries, the fact that we seek to invest in well-capitalized companies with competent management teams, tends to result in the Fund periodically benefiting from such structural changes when they do arise.”

Coming back to the Pool, the combined entity was renamed to Viterra. In 2008, thanks to rising commodity prices, record grain volumes and added cost savings from Agricore, Viterra reaped a bountiful harvest of $288.3 million in net income, up 147% from 2007.

2008-2010: Viterra buys ABB
While Viterra is going through its developments, TAM started to build a large position in a Australian grain handler called ABB that had operations very similar to Viterra in Australia. I will come to why this is relevant to the Viterra story at a further time below. TAM initiated its position in ABB in Q2 2006 and continued increasing its position in the remaining of 2006 and through 2007-2008. What follows is Wadhwaney’s detailed business analysis on ABB and Viterra from his Q2 2008 letter to shareholders (key points are highlighted in bold).

“The two investments which currently dominate the Fund’s agricultural holdings are ABB Grain Limited (“ABB”) and Viterra, Inc. (“Viterra”). Both of these companies are focused on agricultural infrastructure, the former in Australia and the latter in Canada. The companies’ operating results are influenced only indirectly, at best, by price movements in the commodities in which they traffic.

Both companies are agribusinesses with multi-faceted operations and an international focus. ABB accumulates grain mostly from South Australia, while Viterra’s source of grain is primarily the Western Canadian provinces. While each company’s history is steeped in grain accumulation, the present reflects much more diversified operations, stretching across the entire supply chain. In the case of ABB, this includes a significant network of silos and export shipping terminals in South Australia, Victoria and New South Wales, incorporating joint ownership of Australian Bulk Alliance with Japanese trading company Sumitomo. Similarly, Viterra has a network of modern, highly efficient grain elevators across the Canadian Prairies connected via railroad to its export shipping terminals in Vancouver and Prince Rupert on the Pacific and Thunder Bay on the Great Lakes. These grain elevator networks and port terminals are the capital intensive portion of a supply chain which comprises operations in storage, handling and logistics, as well as providing a number of value-adding services. Such hard to replicate assets are the key to providing these companies with defensible competitive positions in their respective markets, and represent a meaningful obstacle that a newcomer would have to surmount in establishing itself in the industry.

The other characteristic shared by these two businesses is the sensitivity of their operating earnings to the volumes of grain passing through the network of grain elevators. Accordingly, periods of drought in their respective regions corresponded to reduced grain throughput, poorer profitability and reduced equity market valuations, which provided the Fund opportunities to purchase these shares at attractive long-term valuations.

The above-noted similarities obscure many of the differences between the two companies, stemming from their respective histories, regulatory environments and industry structures. All of these factors are likely to play a significant role in determining the profitability of these companies going forward. What follows is a thumbnail sketch of each company, highlighting some of their respective attributes.

ABB was born as the Australian Barley Board, whose intended role was to coordinate the acquisition and marketing of barley sourced across Australia. In late 2004, ABB Grain was formed by the merger of three South Australia-based grain companies, ABB Grain, AusBulk and United Grower Holdings, expanding its activities to other grains beyond barley. In addition, AusBulk was the parent of JoeWhite Maltings, which is Australia’s largest malting company, with malting plants located in all six Australian states, positioned close to international ports and transport links or to Australia’s premium barley growing areas.

ABB’s range of rural services includes the supply of fertilizer and agricultural chemicals, financial services and insurance, and wool and livestock activities. ABB Grain also has significant operations in New Zealand focused on the trading and distribution of grains and proteins.

A change on the horizon in the Australian grain market, which should represent a significant potential opportunity, is the elimination of the Australian Wheat Board’s export monopoly on wheat later this calendar year. The elimination of the Australian Wheat Board, which is the sole exporter of feed grain wheat, will allow companies like ABB, which have the existing infrastructure, logistical and marketing expertise, to fulfill that role. A second, more conjectural, opportunity might be looming, namely that of consolidation among the various owners of agricultural infrastructure within Australia or even on a cross-border basis. The attractions of the former would include the ability to exploit economies of scale across the combined entity, enhancing the performance of ABB’s network of assets. Cross border transactions (such as a combination of companies operating in different geographies) might potentially provide weather diversification, and reduce the riskiness of the business in the aggregate.

Viterra, on the other hand, was … [history of Viterra]. Estimates of the Prairie grain Viterra currently handles are on the order of about 40% of the volume grown and transported. However, the allocation of railcars for feed grade wheat and barley is overseen by the Canadian Wheat Board (“CWB”) which, unlike its Australian counterpart, continues to regulate the transportation and marketing of these grains. Were CWB’s role in rail car allocation to be eliminated, the percentage of Prairie grain handled by Viterra would rise materially, given its disproportionate ownership of the industry’s most efficient grain elevators. Given the sensitivity of operating performance to grain throughput, were such deregulation to occur, it would have a meaningful, positive impact on the company.

Grain buyers have historically dealt with a highly fragmented grain supply industry. Recently, the industry has changed significantly in Canada; and similar changes appear to be starting to play out in Australia. These changes (consolidation) will likely bring a shift of power within the supply chain, with potential benefits to both ABB and Viterra. Both companies are an integral part of the agricultural infrastructure and play a crucial role in the numerous steps involved in getting grain from producer to consumer. Both companies are well positioned financially, and in their respective market positions. Moreover, both companies are likely to benefit from unusually attractive opportunities as structural changes take place, be it via deregulation, consolidation or resource conversion. As agricultural companies, they continue to be beholden to weather conditions in their respective growing regions. That said, the Fund’s ownership of companies in two geographies, distant from each other, serves to mitigate that risk, somewhat.”

At risk of being repetitive, I will draw your attention to the fact that almost all the key points highlighted above fall in the category of benefits the two companies can derive from resource conversion activities, a cornerstone of safe and cheap investing.

Further, notice the comment on how the Fund’s ownership in two geographies serves to mitigate weather risk. Lo and behold, in 2009, Schmidt made an offer to buy ABB for $1.2 billion and the offer was accepted by 84% of shareholders, with only 75% required to pass the resolution. TAM had been building its position in ABB since 2006, and I doubt (I may be wrong here) if Schmidt at that time had any plans to make the offer to ABB. So, we can only speculate the role that TAM, as one of Viterra’s and ABB larger shareholders, played in bringing this opportunity to Schmidt’s attention. However, if our speculation is indeed true, then this is a great example of how a “safe and cheap” investor can play an active role in helping a company realize its value further through asset conversion (in this case asset combination).

In conclusion, Viterra is a great example of how a CEO (Mayo Schmidt in this case) took a company in a mess ($100 million market cap) to a vibrant growing company ($2.8 billion market cap) through various asset conversions in a decade. Also, if it were not for “safe and cheap” investing framework, one would have easily missed out on this phenomenal opportunity.

References:
• Third Avenue’s pick in Food Chain, Morningstar.
• Aggressive Conservative Investor, Martin Whitman
• Viterra, Wikipedia
• Saskatchewan Wheat Pool, Wikipedia,
• Agricore United, Wikipedia,
• ABB Group, Wikipedia,
• Andrew Wahl, CB Online. Mayo Schmidt, Viterra, Top CEO
• 2004-2009 Annual Reports, Viterra
• 2006-2010 Quarterly Shareholder Letters, Third Avenue Funds

Disclosure: I have a long position in Viterra (VT) and I have investments with Third Avenue Management. Also, this is not a recommendation to buy or sell any securities. Do your own research before investing in any security.

Wednesday, February 3, 2010

Value of Predictions

I am currently on a month long vacation in India, and I meet people in various different lines of business on a daily basis. One of the most common topic of discussion is the growth in the Indian economy and investing in India. I do not disagree that India is going to grow at rapid pace in the next 10-20 years. However, being a value investor, I do not invest based on market forecasts, for lack of margin of safety. I found it extremely challenging trying to explain the rationale for this point of view, so I will do so here.

My thoughts on this subject are mainly influenced by Howard Mark's memo Value of Predictions. It is not useful to just make correct forecasts, but also be able to monetize it.

Expected Value of Forecast = Value of Correct Forecast x Probability of Being Correct.

Being "right" does not lead to superior performance if the consensus forecast is also correct. For example, if the consensus forecast for GDP growth in India is 9%, stocks will come to reflect that expectation. If you conclude that GDP in India will grow at 9% and that motivates you to buy stocks, the stocks you buy will already anticipate this growth. If actual GDP growth in India happens to be 9%, then stock prices will probably not jump - because reaction to this news already took place when the consensus was formed in the past. Instead, you will earn risk-adjusted returns for equities over the holding period.

Everyone's forecasts are, on average, consensus forecasts. If your prediction is consensus too, it won't produce above-average returns even if it's right. Superior performance comes from accurate non-consensus forecasts. But, because most forecasters aren't terrible, they fall near the consensus most of the time - and non-consensus forecasts are usually wrong. Furthermore, accurate non-consensus forecasts are hard to make, and even if you can make them accurately, they are hard to act on.

When interest rates stood at 8% in 1978, most people thought they'd stay there. The interest rate bears predicted 9%, and the bulls predicted 7%. Most of the time, rates would have been in that range, and no one would have made much money.The big profits went to those who predicted 15% long bond yields. But where were those people? Extreme predictions are rarely right, but they're the ones that make you big money.

Not only must a profitable forecast have the event or direction right, but it must be correct at timing as well. Such a forecast is much further away from the conventional wisdom. Holding onto such a position for a long period of time is difficult since it poses career risk (read previous post Market Inefficiency).

Besides, forecasting costs money. Every time you are wrong, you are going to under-perform a buy and hold strategy that emphasizes investing with a margin of safety (read my previous post Two Rules of Investing).

Lastly, you should always be asking why a non-consensus forecast is being shared with you. Groucho Marx said "I wouldn't join any club that would have me as a member." Another formulation may be "I would never act on any forecast that someone would share with me."

All of this does not mean that one should not invest in India. It just means that you are better off not investing in India (or anywhere else) based on macro-forecasts. Instead, invest in businesses that have a strong competitive position, run by competent, honest, and shareholder friendly management, and are selling at discounts from their intrinsic value. I personally find it easier to find such businesses in markets I am familiar with (US and developed nations in Europe) that have a good exposure to emerging markets than in emerging markets themselves (Nestle, Heineken, Diageo, Kone, Unilever, Phillip Morris. Disclosure: Author owns common stock of each of these companies).

Sunday, January 3, 2010

The Psychology of Persuasion


Have you been a patsy to pitches of peddlers, fund-raisers, telemarketers, used-car dealers, or Madoff's Ponzi scheme? Now you can save yourself from being a sucker by reading Robert Cialdini's Influence: The Psychology of Persuasion.

In his book, he identifies six weapons of influence that cause people to comply to the request of others unknowingly.


  • Reciprocation: Research shows that there is no human society that does not feel the obligation to reciprocate. Hence, the pervasiveness of free samples in marketing - charitable organizations sending free labels to real estate firms selling timeshares offering free trips to Mexico.

  • Commitment and consistency: Once we have made a decision, and especially if we've validated that decision through public affirmation, we're loath to change our view. Cialdini offers two deep-seated reasons for this. First, commitment allows us to stop thinking about the issue - it gives us a mental break. And second, consistency allows us to avoid the consequence of reason - namely, that we have to change. The first allows us to stop thinking; the second allows us to stop acting

  • Social Validation: People will do things by observing others. For example, in one experiment, one or more confederates would look up into the sky; bystanders would then loop up into the sky to see what they were seeing. At one point this experiment aborted, as so many people were looking into the sky that they stopped the ongoing traffic

  • Liking: We all prefer to say yes to people we like. We tend to like people who are similar to us, who compliment us, cooperate with us, and who are attractive.

  • Authority: People will tend to obey authority figures, even if they are asked to perform objectionable acts. Cialdini sites the Milgram experiment as one such example. In this enlightening and unsettling human experiment, Stanley Milgram had subjects come in to play the role of a "teacher" for a "learner". The subjects asked the learner questions, and were told by a stern, lab-coated supervisor to administer progressively stronger electric shocks in return for incorrect answers. The learners would scream in pain and beg for mercy to avoid the increasingly painful shocks. Even though they were never forced to do anything, nor were they subject to reprisal, many of the subjects ended up doling out lethal shocks.

  • Scarcity: Evidence shows humans find items and information more attractive if they are either scarce or perceived to be scarce. Companies routinely leverage this tendency by offering products or services for a limited time only.


These tendencies are singularly powerful. But when they are invoked in combinations, they are even more potent and create what Charlie Munger calls lollapalooza effects. Ravi Nagarajan at Rational Walk pointed out how Bernie Madoff used three of the six Cialdini's tools of influence to first bait his victims and then reel them in and keep them quiet for years.

Social Proof: Most of Madoff's victims were Jewish and well connected in Jewish circles in New York City and Florida. Madoff had a long history of supporting the Jewish community and was active in philanthropic activities. Given that Madoff had a number of Jewish wealthy clients, others within the community naturally assumed that Madoff's firm was trustworthy. Social Proof ended up being a reason for herd like behavior within a community where Madoff was well known and respected.

Authority: Over a period of five decades, Madoff built his market making business from an initial investment of only 5000$ starting in 1960. The technology Madoff's firm developed ended up being the technology of the NASDAQ which was founded in 1971. Madoff eventually served as the Chairman of the NASD, a self regulatory securities industry organization. So naturally, Madoff had impeccable credentials and an aura of authority that could be leveraged to gain clients (or rather victims) for his scheme. Would anyone approached by a man with Madoff’s credentials question his decisions or record keeping? After all, this was a man who was heavily involved in NASD and beyond question in terms of perceived integrity.

Scarcity: Madoff did not allow just anyone into his scheme. One did not simply pick up the phone and open an account with Madoff. It was necessary to be well connected and to know the right people. If you knew the right people and if they could “pull some strings”, then just maybe you would be able to get in and have the honor of Madoff handling your assets. This may seen absurd in retrospect, but the perceived scarcity of Madoff’s services and the fact that only the elite could get in served to create the aura of exclusivity that so many people crave. After all, if you could not say that you were invested with Bernard Madoff, what would your friends at the country club in Palm Beach think of you? This is social proof and scarcity wrapped into the same package.